Archive
Program to extract x/y coordinates of points in pdf graphs
There are two techniques for specifying the display information contained in any graph within a pdf file. Raster graphics specifies (e.g., jpeg and png formats) the location and color of pixels, and vector graphics specifies (e.g., pdf and svg) the x/y coordinates of shapes/colors on the page. With vector graphics it’s possible to calculate the graph-axis relative positions of displayed symbols using the page relative x/y positions of each symbol (denoting a measurement point), the graph axis and axis tick marks/values; something I first did out in 2013. My Evidence-base software engineering book contains 10+ datasets that have been manually extracted from vector graphics within pdf files, i.e., by writing a graph specific awk script (a summary of the processes and tools used).
Can coding agents be used to implement a program detects and extracts the x/y coordinates (axis relative) of data points in any graphs, implemented using vector graphics, contained in a pdf file?
Do LLMs know of any tools that already do this? No.
This weekend I attended the Reinvent the Wheel: A Tools for Science Hack, where attendees were given credits for a month of Claude Max (these days I don’t write enough code to make it worth spending more than $20 per month on subscriptions). This was a perfect opportunity, and motivation, to create a specification of the data point x/y coordinate extraction process, and then to attempt to get a coding agent to generate a python program that extracted this data from any pdf file (whose plots were created using vector graphics).
Data points within a graph are drawn using a variety of symbols, and the symbols are drawn using a variety of techniques. For instances, a circle might be drawn using a single internal pdf instruction, drawing four quadrants using Bézier curves, or even eight Bézier curves, or who knows what (it’s very frustrating).
Then there are the tick marks along the axis, some of which are labelled with numeric values, don’t always start/finish at the ends of the axis, and denote a scale that could be linear or logarithmic.
My plan was to specify what was required, briefly describe the internal organization of a pdf file, provide a pdf file containing a single graph and the corresponding extracted data, as a csv file, and see what happens.
The start of my conversation with Claude Opus 5.5 follows:
Write a python program that takes as input a pdf file and outputs the x/y coordinates of individual data points displayed using vector graphics. The vector graphics, as specified by internal pdf instructions, used to display these data points appear on lines bracketed by lines that just contain the words "stream" and "endstream" The data points appear within a graph displayed on a page. This graph contains an x and y axis and may contain other unrelated lines and text within the plot's x/y axis. The required x/y data point coordinates must be relative to the values displayed on the plot's x and y axis. Each x and y axis is drawn as one long line and short tick marks for particular axis values. An internal instruction is used to display a numeric value close to its associated tick mark. Various symbols may be used to display each data point. For instance, in the attached pdf file a data point is denoted by a circle created by joining four bezier curves. The required x/y coordinate is at the center of the approximate circle drawn by these four bezier curves. All data point coordinates must be output, even data points having the same x/y coordinates as other data points. The attached file schump.tgz contains a pdf file and a csv file containing the internal x/y positions of the data points and the corresponding graph relative x/y positions, it also contains the page number and the color of the data points. Each graph is numbered. |
It took about 15 minutes to create a python program that extracted the information from the pdf file that matched the contents of the csv file. I was impressed.
The generated program was then extended one feature at a time by describing some possible characteristics of a graph, and attaching a pdf containing a graph containing those characteristics; for instance (another 15-20 minutes):
Extend the program to support data points displayed as a diamond shape created by drawing four lines. The attached file 53cfc681e8e2afa9feb5820f4886e3018005-009.pdf is a pdf file. The data points are denoted by diamonds created by drawing four short lines. |
This one/two feature at a time iteration looped six or so times before I grouped the remaining features into one update. Two+ hours later Claude provided 4K+ LOC of python code that appeared to handle everything.
The most impressive behavior was spotting minor issues that I had not mentioned and supporting them, or asking if they should be supported.
The pdfgraph2csv GitHub repo contains the code + regression tests.
Is the information in the output csv files correct?
The x/y coordinates of the points in the graphs in my book are available to be checked against. I also plan to repeat the process using a coding agent from another vendor, and to compare the contents of the corresponding csv files. N-version programming, here we come.
Programming language choice is becoming a build option
What significant problems do high-level programming languages solve in a world of coding agents?
The original rationale for using high-level languages was to reduce the cost of porting existing software to different platforms. In a coding agent world, this is a benefit for those interested in having their software run on more than one platform. Is it a worthwhile benefit for those running on just iOS and Android (Shopify recently switched to a common codebase in React Native)? A general answer to this question will have to wait until things have settled down, some years from now.
Some software systems have configuration options that are selected at compile time. Having coding agents generate all possible option configurations is only practical when there are only a few possible combinations. The Linux kernel contains around 15,000 options, and while many of the  possible option combinations are unrealistic, just 243,323 combinations produces a huge variety of executable programs. The source code approach is the only workable approach when many compiler time options need to be supported.
Existing practice is that program source code is written in a high level language, which is then translated to an executable form. Generating source in the programming language(s) being actively used enables coding agents to be seamlessly integrated into existing practices.
In specification based programming, English (or another human language) is the language used to create software. The actual programming language used when generating source code is not yet irrelevant.
Various kinds of activities are reviewed during the development of a software system. These include: requirements review, design review, code review, test review, and acceptance review.
Source code is needed for code review, which is frequently talked about but infrequently performed (an analysis of evidence; see section 6.6.1 for a summary of practices). Code review is a great mechanism for synchronizing practices within a team, training new developers and generally keeping team members up to date with what others are doing. These are benefits that apply when software is written by people. When source is generated by a coding agent, why do people need to review it? The reasons I have heard involve issues covered during requirements and design reviews. Another coding agent might check the code looking for mistakes, and this could be labelled as a (non-human) code review.
If the generated source is not going to be read by people, does it matter which programming language is used to generated it?
Coding agents require source code for training, and this is available in a variety of programming languages. Quantity of source code training data has a significant impact on LLM performance. Generating source in the language most likely to elicit the best coding agent performance is the obvious answer.
Choice of programming language is sometimes driven by current fashions, happenstance or a particular belief system. For instance, the conversion of existing non-Rust source to Rust is driven by the current fashionably status of that language, along with the effectiveness and low cost of coding agents.
Programming languages choice is evolving in to being a configuration option.
I’m sure that eventually somebody will convert the Linux kernel to Cobol and build a running system. As a start, I used the Devin coding agent to convert the contents of the kernel init directory to Cobol source and Fortran source. Both sets of source compile, but don’t link against any other kernel object files.
Before coding agents hackers were content to create their own new Linux distribution. To be leading edge in the future, a hacker will need to translate the Linux kernel and/or distribution to a language of their own creation (LLMs are now building compilers).
Single-handedly creating/implementing a language and using it to implement an operating system used to be a niche activity. First released in 2005, Terry A. Davis single-handedly wrote TempleOS in a language he created and implemented called HolyC, driven by a revelation from God. In the coming years, I expect to see many of these belief driven projects.
Impact of input distribution on faults experienced
The impact of user input variability on number of reported faults is an important issue that is rarely researched. Appropriate user input is one of the three events that needs to occur for a software system to experience a fault. Program fault reports are caused by its users.
I am not aware of any published studies providing the evidence that a change in the distribution of program input values does indeed produce a change in the number of faults experienced. However, the supporting material of a recent paper on N-version programming contains everything needed for me to provide the evidence.
The paper N-Version Programming with Coding Agents by Ron, Baudry, and Monperrus [RBM] uses coding agents to create many implementations of the same specification.
The specification is for a missile tracking simulation program, and the input is a set of (x, y) coordinates representing two-dimensional radar tracks. The program is required to decide whether the set of points meets a combination of 15-conditions for the detection of an incoming missile, whose detection would cause the launch of an interceptor missile. Previous analysis of the RBM data.
In the RBM paper, for testing, the set of (x, y) values were randomly drawn from a uniform distribution, within bounds [-100, 100]. Drawing the (x, y) from a different distribution should cause the number of detected faults to change. I modified the test generator to use a triangular distribution. The mode (i.e., the peak) of the distribution was at: -90, 0, or 90 (the distribution is symmetric, so the results should be the same for -90 and 90; in practice they might not be {they were}).
The initialization loop at line 117 in the file generator.py was modified to call rng.triangular; for instance:
# x = [float(v) for v in rng.uniform(-100, 100, size=numpoints)] # y = [float(v) for v in rng.uniform(-100, 100, size=numpoints)] x = [float(v) for v in rng.triangular(left=-100, mode=0, right=100, size=numpoints)] y = [float(v) for v in rng.triangular(left=-100, mode=0, right=100, size=numpoints)] |
The plot below shows the three triangular distributions used, and a uniform distribution (code+data):
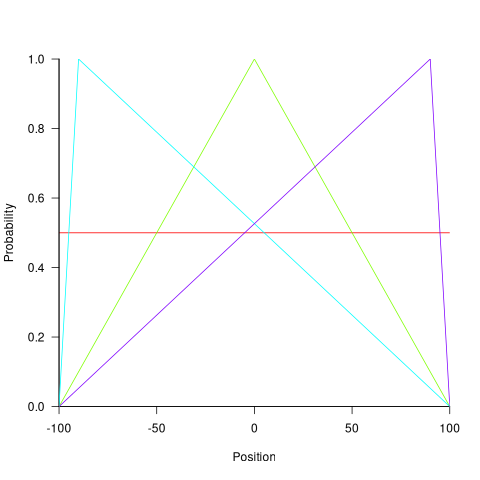
Changing the distribution of the generated points changes the average distance between two randomly chosen points. Given that the 15-conditions involve: the distance between consecutive pairs of points, and three consecutive points fitting within a circle of a given radius, a change of average distance will change the number of detected incoming missiles.
The table below shows the mean distance between two points when the (x, y) values are randomly chosen from the corresponding distribution (LLM derivation), and the corresponding normalised failure rate for three of the generated programs (replicating the original 1-million tests with four of the generated programs; code+data):
x distribution y distribution Mean distance Failure rate Uniform Uniform 104 1.0 Triangular mode 90 Uniform 93 1.9 Triangular mode 0 Uniform 89 2.0 Triangular mode 90 Triangular mode 90 82 3.6 Triangular mode 90 Triangular mode 0 76 3.7 Triangular mode 0 Triangular mode 0 73 3.9 |
The failure rate is normalised to that for the Uniform distribution. The increase in failure rate, as the mean distance between points decreases is a consequence of the particular coding mistakes in the generated programs. Different coding mistakes could produce a decreasing failure rate with distance (it decreased for the python implementation tested, but the rate did not change with distance)
The RBM study used a random number seed of 42. The maximum difference in number of detected faults, for a uniform distribution, when using seeds of 42, 202, 321, 789, 6000, and 20101 was around 10-20%. Changing the distribution had a significantly larger impact than changing the random number seed.
Recent Comments