Archive
My 2023 in software engineering
In a 2009 post, I predicted that Chinese and Indian developers would become a major influence in the next decade. This year, it was very noticeable that many of the authors of papers at major conferences had Asian names. I would say that, on average, papers with Asian author names were better than papers by authors with non-Asian names.
While LLMs dominated the software news this year, the lead time for research projects and conference submission deadlines meant that few of the papers accepted at this year’s top ranked conferences were LLM based, e.g., around 5% at ICSE. I expect there will be a much higher percentage of LLM based papers in 2024, which I think will be a disaster for software engineering research, at least in the short term. From what I have seen and read, much of LLM based software engineering is driven by fashion and/or a desire to gain experience that leads to a job in AI. Discovering something useful about software development takes a back seat (the current fashionable topic, butterfly collecting, at least produces potentially useful datasets). I think that LLMs are going to be very useful for analyzing text data, e.g., named entity recognition.
London based, software related meetups have come back to life. I go to around 1-2 a week, and the regular good ones include: Internet of Things, Extreme Tuesday Club, London Prompt Engineers, and London R. On the academic front, I have started attending the software reliability seminars at Imperial, and funding means that the excellent Crest Open Workshops are down to two a year. There were a handful of hackathons this year, and I got to go to one of them, a LLM hackathon.
Not usually software specific: Newspeak House hosts a variety of events that are often attended by many developers and those associated with the rationalist community. I attend maybe 2–3 events a month.
What did I learn/discover about software engineering this year?
- A small team estimation dataset showed the same kinds of patterns seen in larger teams,
- more cost/benefit analysis of software engineering activities here and here,
- data on Cobol source is very rare, and I found some,
- programs often continue to work very well in the presence of serious coding mistakes; I discovered some conditions where this occurs (to be continued next year),
- yet more debunking of software folklore: Optimal function length, and Hardware/Software cost ratio,
- I fell down the rabbit hole of early computer performance and their benchmarks.
The evidence-based software engineering Discord channel ticks over (invitation), with sporadic interesting exchanges.
Sample size needed to compare performance of two languages
A humungous organization wants to minimise one or more of: program development time/cost, coding mistakes made, maintenance time/cost, and have decided to use either of the existing languages X or Y.
To make an informed decision, it is necessary to collect the required data on time/cost/mistakes by monitoring the development process, and recording the appropriate information.
The variability of developer performance, and language/problem interaction means that it is necessary to monitor multiple development teams and multiple language/problem pairs, using statistical techniques to detect any language driven implementation performance differences.
How many development teams need to be monitored to reliably detect a performance difference driven by language used, given the variability of the major factors involved in the process?
If we assume that implementation times, for the same program, have a normal distribution (it might lean towards lognormal, but the maths is horrible), then there is a known formula. Three values need to be specified, and plug into this formula: the statistical significance (i.e., the probability of detecting an effect when none is present, say 5%), the statistical power (i.e., the probability of detecting that an effect is present, say 80%), and Cohen’s d; for an overview see section 10.2.
Cohen’s d is the ratio }/sigma") , where
, where  and
and  is the mean value of the quantity being measured for the programs written in the respective languages, and
  is the pooled standard deviation.
Say the mean time to implement a program is , what is a good estimate for the pooled standard deviation, , of the implementation times?
Having 66% of teams delivering within a factor of two of the mean delivery time is consistent with variation in LOC for the same program and estimation accuracy, and if anything sound slow (to me).
Rewriting the Cohen’s d ratio: }/{2*mu_x}={abs(1-{mu_y}/mu_x)}/2")
If the implementation time when using language X is half that of using Y, we get }/2=0.5") . Plugging the three values into the
. Plugging the three values into the pwr.t.test function, in R’s pwr package, we get:
> library("pwr")
> pwr.t.test(d=0.5, sig.level=0.05, power=0.8)

     Two-sample t test power calculation

              n = 63.76561
              d = 0.5
      sig.level = 0.05
          power = 0.8
    alternative = two.sided

NOTE: n is number in *each* group |
In other words, data from 64 teams using language X and 64 teams using language Y is needed to reliably detect (at the chosen level of significance and power) whether there is a difference in the mean performance (of whatever was measured) when implementing the same project.
The plot below shows sample size required for a t-test testing for a difference between two means, for a range of X/Y mean performance ratios, with red line showing the commonly used values (listed above) and other colors showing sample sizes for more relaxed acceptance bounds (code):
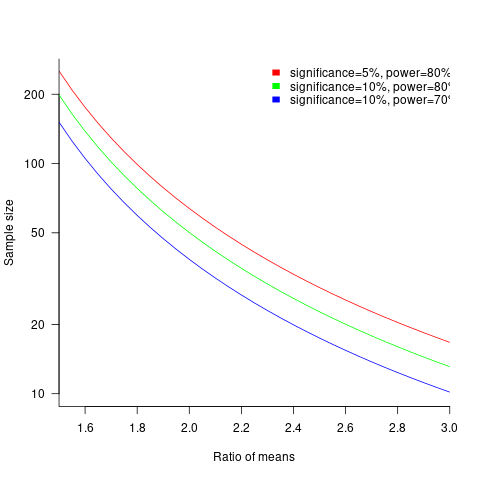
Unless the performance difference between languages is very large (e.g., a factor of three) the required sample size is going to push measurement costs into many tens of millions (£1 million per team, to develop a realistic application, multiplied by two and then multiplied by sample size).
For small programs solving certain kinds of problems, a factor of three, or more, performance difference between languages is not unusual (e.g., me using R for this post, versus using Python). As programs grow, the mundane code becomes more and more dominant, with the special case language performance gains playing an outsized role in story telling.
There have been studies comparing pairs of languages. Unfortunately, most have involved students implementing short problems, one attempted to measure the impact of programming language on coding competition performance (and gets very confused), the largest study I know of compared Fortran and Ada implementations of a satellite ground station support system.
The performance difference detected may be due to the particular problem implemented. The language/problem performance correlation can be solved by implementing a wide range of problems (using 64 teams per language).
A statistically meaningful comparison of the implementation costs of language pairs will take many years and cost many millions. This question is unlikely to every be answered. Move on.
My view is that, at least for the widely used languages, the implementation/maintenance performance issues are primarily driven by the ecosystem, rather than the language.
Patches for the code of Peter Turchin’s Attrition Warfare Model
The paper Empirically Testing Predictions of an Attrition on Warfare Model for the War in Ukraine, by Peter Turchin, recently showed up during one of my regular searches for software engineering data. A quick scan of the paper founded that it is very empirical, and that the analysis coding was done in R; I could not resist checking out the source code.
One of my first jobs was helping academics fix coding issues with the programs they had written to solve scientific/engineering problems, and this R code reminded me of several habits of scientists who code: the single letter variables used in equations are directly mapped to identifier names, and there is no structure to the code. The code is so short (86 lines) that the lack of structure is a minor inconvenience; a few thousand lines, and it becomes a major headache. The code for Imperial’s COVID model was ten times larger.
Two mistakes in the code/paper jumped out at me, leading to this post. First, some background.
The empirical predictions in the paper are intended to provide insight into who is likely to win the ongoing Ukraine/Russia war. Fighting requires soldiers and these are killed/wounded over time. The country that does not have enough soldiers to at least keep the opposition at bay, looses.
Turchin has proposed what he calls the Attrition War model, based on Lanchester’s laws (various attempts to validate Lanchester’s models, lots of maths to shake a stick at), and the paper solves this model’s set of eight differential equations (each country has the same set of four equations; the connection between the two sets is that one country’s casualty rate and Army size is influenced by the opposing country’s stock of war matériel). The four quantities modelled are casualties, army size, stock of warfare matériel, and production capacity.
Getting predictions out of differential equations requires being able to find a solution to the equations and feeding in numeric values for the various parameters.
Solving the equations is a maths problem, i.e., no knowledge of military matters required. Selecting the equations to solve and the numeric values to feed into the solution is what requires military knowledge. I don’t know anything about military matters; the following analysis is purely related to writing code to solve a set of differential equations, using the equations plus numeric values in Turchin’s November 2023 paper.
For obvious reasons, countries involved in the war do not publish information on the quantities modelled by these equations (which are also likely to be time-dependent). Turchin addresses the changeable nature of the numeric values by introducing various random components into his Attrition model.
From the perspective of solving the eight equations and presenting the results, the following are the two mistakes that jumped out at me (both involving the implementation of the random component):
- When a model contains a random component, there will be a huge/infinite number of possible solutions. The takeaway plots in the paper show a single solution (for each of the four variables/two countries), with the width of the plotted lines and their fluctuating appearance suggesting that they contain multiple solutions. The plot below left shows the solution for artillery shell production over time, as it appears in the paper, while the plot below right shows 100 solutions (each line is a different solution; code):
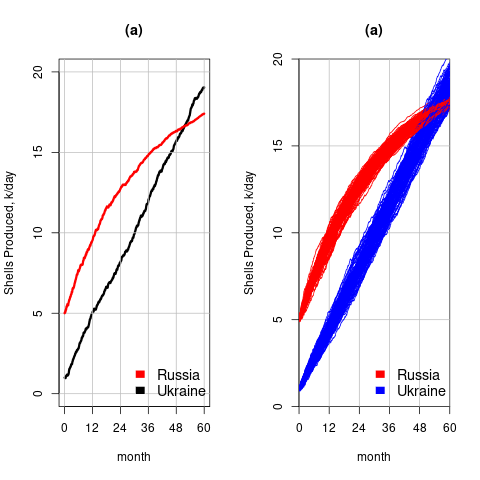
The wedge of lines shows the range of possible solutions (each line drawn overwrites anything previously drawn, and plotting with transparent colors would show the density of solution at a given point; I decided to keep the code simple).
- All the random components are assumed to have a Gaussian distribution. When distribution information is not available, this is usually a safe choice. However, two of the random components must always have non-negative values (i.e., casualties and matériel used can never be negative). The Poisson distribution is the obvious candidate, and a simple search turned up an empirical paper agreeing with this choice (at least for casualties).
The plot below left shows one solution for the number of casualties over time, using the original code, while the plot below right shows 100 solutions using a Poisson distribution for the random component (code):
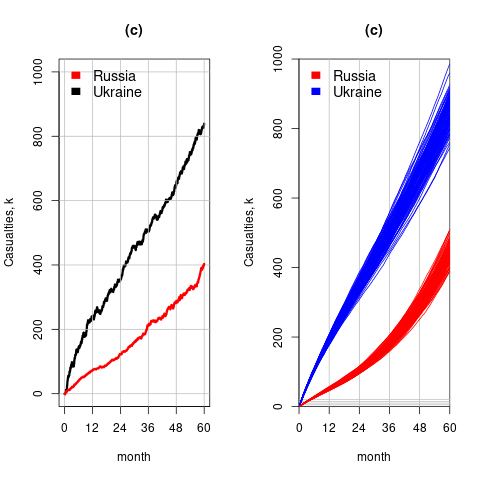
With a Poisson random component, the solutions don’t meander as much, and the variance is smaller than when a Gaussian is used. Technically, it is a more accurate model (if more variance is to be expected a Negative Binomial distribution could be used; see commented out code)
The latest (November) UK government estimate of Russian casualties is 300K, roughly three times larger than predicted by Turchin’s model. Changing the value for the ‘conversion rate of expended matériel to casualties’ from
 to
to  brings the casualty prediction inline with current estimates (we have been hearing a lot about the accuracy of the Ukrainian targetting; see code for details).
I have also reworked the code to add some structure, e.g., separating out solving the equations and setting the initial conditions.
Turchin used the traditional approach to solving differential equations, the one we are taught at school. Before seeing the code, I was half expecting to see a System dynamics approach. The advantage of a systems dynamic approach is flexibility (i.e., easier to add more components) and visualization (i.e., a chart showing what feeds into/out of what); an example. There is an R-based book: System Dynamics Modelling with R.
Christmas books for 2023
This year’s Christmas book list, based on what I read this year, and for the first time including a blog series that I’m sure will eventually appear in book form.
“To Explain the World: The discovery of modern science” by Steven Weinberg, 2015. Unless you know that Steven Weinberg won a physics Nobel prize, this looks like just another history of science book (the preface tells us that he also taught a history of science course for over a decade). This book is written by a scientist who appears to have read the original material (I’m assuming in translation), who puts the discoveries and the scientists involved at the center of the discussion; this is not the usual historian who sprinkles in a bit about science, while discussing the cast of period characters. For instance, I had never understood why the work of Galileo was considered to be so important (almost as a footnote, historians list a few discoveries of his). Weinberg devotes pages to discussing Galileo’s many discoveries (his mathematics was a big behind the times, continuing to use a geometric approach, rather than the newer algebraic techniques), and I now have a good appreciation of why Galileo is rated so highly by scientists down the ages.
Chapter 2 of “When Old Technologies Were New: Thinking about electric communication in the late nineteenth century” by Carolyn Marvin, 1988. The book is worth buying just for chapter 2, which contains many hilarious examples of how the newly introduced telephone threw a spanner in to the workings of the social etiquette of the class of person who could afford to install one. Suitors could talk to daughters without other family members being present, public phone booths allowed any class of person to be connected directly to the man of the house, and when phone companies started publishing publicly available directories containing subscriber name/address/number, WELL!?! In the US there were 1 million telephones installed by 1899, and subscribers were sometimes able to listen to live musical concerts and sports events (commercial radio broadcasting did not start until the 1920s).
“The Grand Strategy of the Roman Empire: From the first century A.D. to the third” by Edward Luttwak, 1976; h/t Mr. and Mrs. Psmith’s review. I cannot improve or add to John Psmith’s review. The book contains more details; the review captures the essence. On a related note, for the hard core data scientists out there: Early Imperial Roman army campaigning: observations on marching metrics, energy expenditure and the building of marching camps.
“Innovation and Market Structure: Lessons from the computer and semiconductor industries” by Nancy S. Dorfman, 1987. An economic perspective on the business of making and selling computers, from the mid-1940s to the mid-1980s. Lots of insights, (some) data, and specific examples (for the most part, the historians of computing are, well, historians who can craft a good narrative, but the insights are often lacking). The references led me to: Mancke, Fisher, and McKie, who condensed the 100K+ pages of trial transcript from the 1969–1982 IBM antitrust trial down to 1,500+ pages of Historical narrative.
Worshipping the Future by Helen Dale and Lorenzo Warby. Is “… a series of essays dissecting the social mechanisms that have led to the strange and disorienting times in which we live.” The series is a well written analysis that attempts to “… understand mechanisms of how and the why, …” of Woke.
Honourable mentions
“The Big Con: The story of the confidence man and the confidence trick” by David W. Maurer (source material for the film The Sting).
“Cubed: A secret history of the workplace” by Nikil Saval.
Software engineering’s F word
I know of two conversation topics that are guaranteed to make software developers feel uncomfortable, and even walk away: 1) complaining about ChatGPT’s refusable to say anything nice about Adolf Hitler, 2) enquiring why so few people are willing to talk about software engineering’s three letter F word (I actually say the F word).
Academics don’t like to use the F word, preferring phrases such as recreational value (and then only for Open source; earlier this year, I used hedonistic activity in the title of a blog post). A 2012 review of motivation in open source development found 10, out of 40, papers listing the F word as a motivator (all published in management related venues).
The F word occurs in the title of a 1991 article in the newsletter The Software Practitioner, aimed at professional developers: “Torn Between Fun and Tedium” by Bruce Blum. The article appears to be lost, but is discussed in the book software creativity 2.0 by Robert Glass.
Blum assumes that software development work is either Fun or Tedium, and assigns a Fun/Tedium percentage to various phase of a Waterfall software lifecycle.
Selling the project concept is assigned 100/0 by Blum, (i.e., 100% Fun; me: 80/20), developing the requirements is 50/50 (me: 20/80), top level design is 40/60 (me: 80/20), detailed design 33/67 (me: no idea), programming 75/25 (me: agree), testing 33/67 (me: 75/25), and maintenance 0/100 (me: 25/75).
I regularly have younger developers tell me that they picked a particular new technology because it looked like fun to learn and use; older developers have been through this phase new technology phase, and sometimes other phases, and have moved onto being more interested in avoiding grief.
Where is the evidence for this fun seeking? Asking developers about fun in their software engineering day job is not socially acceptable, but it is ok to ask about fun in personal projects.
I suspect that managers who have had little contact with working developers would be shocked by the extent to which fun motivates developer decisions; managers who have had to deal with the practicalities of herding developers less so.
Recent Comments