Archive
The software heritage of K&R C
The mission statement of the Software Heritage is “… to collect, preserve, and share all software that is publicly available in source code form.”
What are the uses of the preserved source code that is collected? Lots of people visit preserved buildings, but very few people are interested in looking at source code.
One use-case is tracking the evolution of changes in developer usage of various programming language constructs. It is possible to use Github to track the adoption of language features introduced after 2008, when the company was founded, e.g., new language constructs in Java. Over longer time-scales, the Software Heritage, which has source code going back to the 1960s, is the only option.
One question that keeps cropping up when discussing the C Standard, is whether K&R C continues to be used. Technically, K&R C is the language defined by the book that introduced C to the world. Over time, differences between K&R C and the C Standard have fallen away, as compilers cease supporting particular K&R ways of doing things (as an option or otherwise).
These days, saying that code uses K&R C is taken to mean that it contains functions defined using the K&R style (see sentence 1818), e.g.,
writing:
int f(a, b) int a; float b; { /* declarations and statements */ } |
rather than:
int f(int a, float b) { /* declarations and statements */ } |
As well as the syntactic differences, there are semantic differences between the two styles of function definition, but these are not relevant here.
How much longer should the C Standard continue to support the K&R style of function definition?
The WG14 committee prides itself on not breaking existing code, or at least not lots of it. How much code is out there, being actively maintained, and containing K&R function definitions?
Members of the committee agree that they rarely encounter this K&R usage, and it would be useful to have some idea of the decline in use over time (with the intent of removing support in some future revision of the standard).
One way to estimate the evolution in the use/non-use of K&R style function definitions is to analyse the C source created in each year since the late 1970s.
The question is then: How representative is the Software Heritage C source, compared to all the C source currently being actively maintained?
The Software Heritage preserves publicly available source, plus the non-public, proprietary source forming the totality of the C currently being maintained. Does the public and non-public C source have similar characteristics, or are there application domains which are poorly represented in the publicly available source?
Embedded systems is a very large and broad application domain that is poorly represented in the publicly available C source. Embedded source tends to be heavily tied to the hardware on which it runs, and vendors tend to be paranoid about releasing internal details about their products.
The various embedded systems domains (e.g., 8, 16, 32, 64-bit processor) tend to be a world unto themselves, and I would not be surprised to find out that there are enclaves of K&R usage (perhaps because there is no pressure to change, or because the available tools are ancient).
At the moment, the Software Heritage don’t offer code search functionality. But then, the next opportunity for major changes to the C Standard is probably 5-years away (the deadline for new proposals on the current revision has passed); plenty of time to get to a position where usage data can be obtained 🙂
Open source: the goody bag for software infrastructure
For 70 years there has been a continuing discovery of larger new ecosystems for new software to grow into, as well as many small ones. Before Open source became widely available, the software infrastructure (e.g., compilers, editors and libraries of algorithms) for these ecosystems had to be written by the pioneer developers who happened to find themselves in an unoccupied land.
Ecosystems may be hardware platforms (e.g., mainframes, minicomputers, microcomputers and mobile phones), software platforms (e.g., Microsoft Windows, and Android), or application domains (e.g., accounting and astronomy)
There are always a few developers building some infrastructure project out of interest, e.g., writing a compiler for their own or another language, or implementing an editor that suites them. When these projects are released, they have to compete against the established inhabitants of an ecosystem, along with other newly released software clamouring for attention.
New ecosystems have limited established software infrastructure, and may not yet have attracted many developers to work within them. In such ‘virgin’ ecosystems, something new and different faces less competition, giving it a higher probability of thriving and becoming established.
Building from scratch is time-consuming and expensive. Adapting existing software systems speeds things up and reduces costs; adaptation also has the benefit of significantly reducing the startup costs when recruiting developers, i.e., making it possible for experienced people to use the skills acquired while working in other ecosystems. By its general availability, Open source creates competition capable of reducing the likelihood that some newly created infrastructure software will become established in a ‘virgin’ ecosystem.
Open source not only reduces startup costs for those needing infrastructure for a new ecosystem, it also reduces ongoing maintenance costs (by spreading them over multiple ecosystems), and developer costs (by reducing the need to learn something different, which happened to be created by developers who built from scratch).
Some people will complain that Open source is reducing diversity (where diversity is viewed as unconditionally providing benefits). I would claim that reducing diversity in this case is a benefit. Inventing new ways of doing things based on the whims of those doing the invention is a vanity project. I have nothing against people investing their own resources on their own vanity projects, but let’s not pretend that the diversity generated by such projects is likely to provide benefits to others.
By providing the components needed to plug together a functioning infrastructure, Open source reduces the cost of ecosystem ‘invasion’ by software. The resources which might have been invested building infrastructure components can be directed to building higher level functionality.
Where are we with models of human learning?
Learning is an integral part of writing software. What have psychologists figured out about the characteristics of human learning?
A study of memory, published in 1885, kicked off the start of modern psychology research. At the start of the 1900s, learning research was still closely tied to the study of the characteristics of what we now call working memory, e.g., measuring the time taken for subjects to correctly recall sequences of digits, nonsense syllables, words and prose. By the 1930s, learning was a distinct subject in its own right.
What is now known as the power law of learning was first proposed in 1926. Wikipedia is right to use the phrase power law of practice, since it is some measure of practice that appears in the power law of learning equation:  , where:
  is the time taken to do the task,
 is some measure of practice (such as the number of times the subject has performed the task), and
  ,
,  , and
, and  are constants fitted to the data.
For the next 70 years some form of power law did a good job of fitting the learning data produced by researchers. Then in 1997 a paper pointed out that researchers were fitting aggregate data (i.e., one equation fitted to all subject data), and that an exponential equation was a better fit to individual subject response times:  . The power law appeared to be the result of aggregating the exponential response performance of multiple subjects; oops.
What is the situation today, 25 years later? Do the subsystems of our brains produce a power law or exponential improvement in performance, with practice?
The problem with answering this question is that both equations can fit the available data quite well, with one being a technically better fit than the other for different datasets. The big difference between the two equations is in their tails, however, it is costly and time-consuming to obtain enough data to distinguish between them in this region.
When discussing learning in my evidence-based software engineering book, I saw no compelling reason to run counter to the widely cited power law, but I did tell readers about the exponential fit issue.
Studies of learnings have tended to use simple tasks; subjects are usually only available for a short time, and many task repetitions are needed to model the impact of learning. Simple tasks tend to be dominated by one primary activity, which means that subjects can focus their learning on this one activity.
Complicated tasks involve many activities, each potentially providing distinct learning opportunities. Which activities will a subject focus on improving, will the performance on one activity improve faster than others, will the approach chosen for one activity limit the performance on a second activity?
For a complicated task, the change in performance with amount of practice could be a lot more complicated than a single power law/exponential equation, e.g., there may be multiple equations with each associated with one or more activities.
In the previous paragraph, I was careful to say “could be a lot more complicated”. This is because the few datasets of organizational learning show a power law performance improvement, e.g., from 1936 we have the most cited study Factors Affecting the Cost of Airplanes, and the less well known but more interesting Liberty shipbuilding from the 1940s.
If the performance of something involving multiple people performing many distinct activities follows a power law improvement with practice, then the performance of an individual carrying out a complicated task might follow a simple equation; perhaps the combined form of many distinct simple learning activities is a simple equation.
Researchers are now proposing more complicated models of learning, along with fitting them to existing learning datasets.
Which equation should software developers use to model the learning process?
I continue to use a power law. The mathematics tend to be straight-forward, and it often gives an answer that is good enough (because the data fitted contains lots of variance). If it turned out that an exponential would be easier to work with, I would be happy to switch. Unless there is a lot of data in the tail, the difference between power law/exponent is usually not worth worrying about.
There are situations where I have failed to successfully add a learning (power law) component to a model. Was this because there was no learning present, or was the learning not well-fitted by a power law? I don’t know, and I cannot think of an alternative equation that might work, for these cases.
How large an impact does social conformity have on estimates?
People experience social pressure to conform to group norms. How big an impact might social pressure have on a developer’s estimate of the effort needed to implement some functionality?
If a manager suggests that the effort likely to be required is large/small, I would expect a developer to respond accordingly (even if the manager is thought to be incompetent; people like to keep their boss happy). Of course, customer opinions are also likely to have an impact, but what about fellow team members, or even the receptionist. Until somebody runs the experiments, we are going to have to do with non-software related tasks.
A study by Molleman, Kurversa, and van den Bos asked subjects (102 workers on Mechanical Turk) to estimate the number of animals in an image (which contained between 50 and 100 ants, flamingos, bees, cranes or crickets). Subjects were given 30 seconds to respond, and after typing their answer they were told that “another participant had estimated X“, and given 45 seconds to give a second estimate. The ‘social pressure’ estimate, X, was chosen to be around 15-25% larger/smaller than the estimate given (values from a previous experiment were randomly selected).
The plot below shows the number of second estimates where there was a given percentage change between the first and second estimates, red line is a loess fit; the formula used is  (code+data):
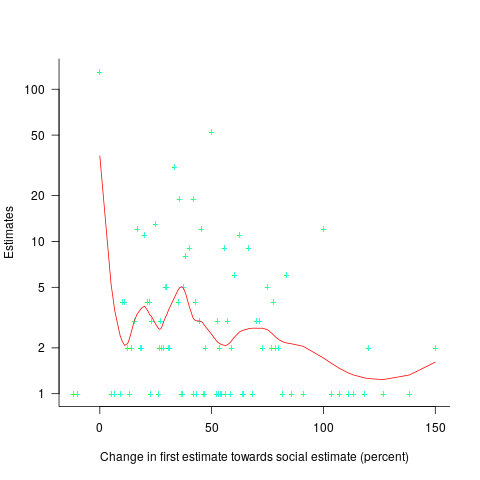
Around 25% of second estimates were unchanged, and 2% were changed to equal the social estimate. In two cases the second estimate was less than the first, and in eleven cases it was larger than the social estimate. Both the mean and median for shift towards the social estimate were just over 30% of the difference between the first estimate and the social estimate.
As with previous estimating studies, a few round numbers were often chosen. I was interested in finding out what impact the use of a round number value for the first estimate, or the social estimate, might have on the change in estimated value. The best regression model I could find showed that if the first estimate was exactly divisible by 5 (or 10), then the second estimate was likely to be around 5% larger. In fact divisible-by-5 was the only variable that had any predictive power.
My initial hypothesis was that the act of choosing a round number is an expression of uncertainty, and that this uncertainty increases the impact of the social estimate (when making the second estimate). An analysis of later experiments suggested that this pattern was illusionary (see below).
Modelling estimate values, rather than their differences, the equation:  explains nearly all the variance present in the data.
Two weeks after the first experiment, all 102 subjects were asked to repeat the experiment (they each saw the same images, in the same order, and social estimates as in the first study); 69 subjects participated. Nine months after the first experiment, subjects were asked to repeat the experiment again; 47 subjects participated, again with each subject seeing the same images in the same order, and social estimates. Thirty-five subjects participated in all three experiments.
To what extent were subjects consistently influenced by the social estimate, across three identical sessions? The Pearson correlation coefficient between both the first/second experiment, and the first/third experiment, was around 0.6.
The impact of round numbers was completely different, i.e., no impact on the second, and a -7% impact on the third (i.e., a reduced change). So much for my initial hypothesis.
The exponents in the above equation did not change much for the data from the second and third reruns of the experiment.
The variability in the social estimates used in these experiments, involving image contents, differs from software estimates in that they were only 12-25% different from the first estimate. Software estimates often differ by significantly larger amounts (in fact, a 12% difference would probably be taken as agreement).
With some teams, people meet to thrash out a team estimate. Data is sometimes available on the final estimate, but data on the starting values is very hard to come by. Pointers to experiments where social estimates are significantly different (i.e., greater than 50%) from the ones given by subjects welcome.
Recent Comments