Archive
The Approximate Number System and software estimating
The ability to perform simple numeric operations can improve the fitness of a creature (e.g., being able to select which branch contains the most fruit), increasing the likelihood of it having offspring. Studies have found that a wide variety of creatures have a brain subsystem known as the Approximate Number System (ANS).
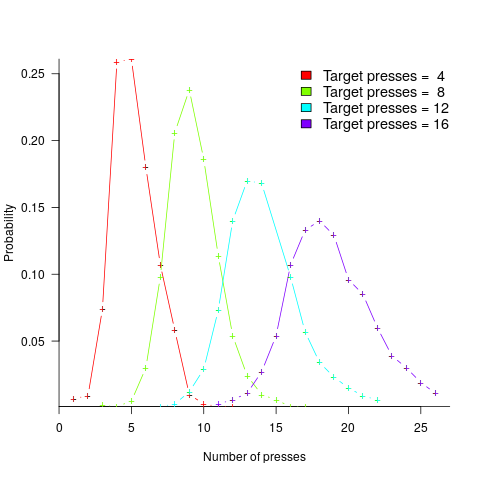
A study by Mechner rewarded rats with food, if they pressed a lever N times (with N taking one of the values 4, 8, 12 or 16), followed by pressing a second lever. The plot below shows the number of lever presses made before pressing the second lever, for a given required N; it suggests that the subject rat is making use of an approximate number system (code+data):
Humans have a second system for representing numbers, which is capable of exact representation, it is language. The Number Sense by Stanislas Dehaene was on my list of Christmas books for 2011.
One method used to study the interface between the two number systems, available to humans, involves subjects estimating the number of dots in a briefly presented image. While reading about one such study, I noticed that some of the plots showed patterns similar to the patterns seen in plots of software estimate/actual data. I emailed the lead author, Véronique Izard, who kindly sent me a copy of the experimental data.
The patterns I was hoping to see are those invariably seen in software effort estimation data, e.g., a power law relationship between actual/estimate, consistent over/under estimation by individuals, and frequent use of round numbers.
Psychologists reading this post may be under the impression that estimating the time taken to implement some functionality, in software, is a relatively accurate process. In practice, for short tasks (i.e., under a day or two) the time needed to form a more accurate estimate makes a good-enough estimate a cost-effective option.
This Izard and Dehaene study involved two experiments. In the first experiment, an image containing between 1 and 100 dots was flashed on the screen for 100ms, and subjects then had to type the estimated number of dots. Each of the six subjects participated in five sessions of 600 trials, with each session lasting about one hour; every number of dots between 1 and 100 was seen 30 times by each subject (for one subject the data contains 1,783 responses, other subjects gave 3,000 responses). Subjects were free to type any value as their estimate.
These kinds of studies have consistently found that subject accuracy is very poor (hardly surprising, given that subjects are not provided with any feedback to help calibrate their estimates). But since researchers are interested in patterns that might be present in the errors, very low accuracy is not an issue.
The plot below shows stimulus (number of dots shown) against subject response, with green line showing  , and red line a fitted regression model having the form
  (which explains just over 70% of the variance; code+data):
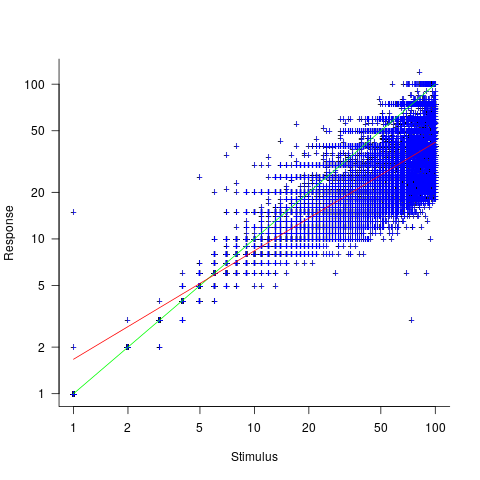
Just like software estimates, there is a good fit to a power law, and the only difference in accuracy performance is that software estimates tend not to be so skewed towards underestimating (i.e., there are a lot more low accuracy overestimates).
Adding subjectID to the model gives:  , with
  varying between 0.65 and 1.57; more than a factor of two difference between subjects (this model explains just under 90% of the variance). This is a smaller range than the software estimation data, but with only six subjects there was less chance of a wider variation (code+data).
The software estimation data finds shows that accuracy does not improve with practice. The experimental subjects were not given any feedback, and would not be expected to improve, but does the strain of answering so many questions cause them to get worse? Adding trial number to the model suggests a 12% increase in underestimation, over 600 trials. However, adding an interaction with SubjectID shows that the performance of two subjects remains unchanged, while two subjects experience a 23% increase in underestimation.
The plot below shows the number of times each response was given, combining all subjects, with commonly given responses in red (code+data):
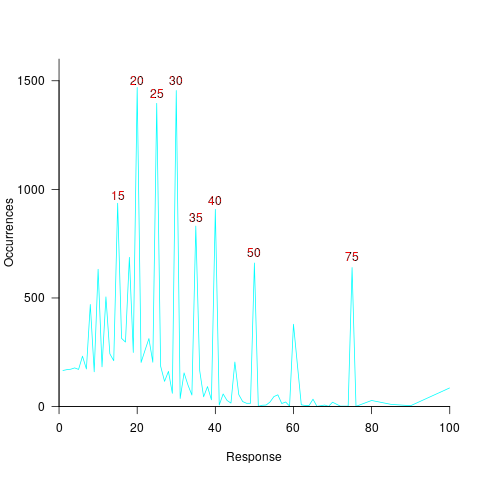
The commonly occurring values that appear in software estimation data are structured as fractions of units of time, e.g., 0.5 hours, or 1 hour or 1 day (appearing in the data as 7 hours). The only structure available to experimental subjects was subdivisions of powers of 10 (i.e., 10 and 100).
Analysing the responses by subject shows that each subject had their own set of preferred round numbers.
To summarize: The results from an experiment investigating the interface between the two human number systems contains three patterns seen in software estimation data, i.e., power law relationship between actual and estimate, individual differences in over/underestimating, and extensive use of round numbers.
Izard’s second experiment limited response values to prespecified values (i.e., one to 10 and multiples of 10), and gave a calibration example after each block of 46 trials. The calibration example improved performance, and the use of round numbers as prespecified response values had the effect of removing spikes from the response counts (which were relatively smooth; code+data)).
We now have circumstantial evidence that software developers are using the Approximate Number System when making software estimates. We will have to wait for brain images from a developer in an MRI scanner, while estimating a software task, to obtain more concrete proof that the ANS is involved in the process. That is, are the areas of the brain thought to be involved in the ANS (e.g., the intraparietal sulcus) active during software estimation?
The Shape of Code is moving
This blog is moving to a new’ish domain (shape-of-code.com), and hosting company (HostGator). The existing url (shape-of-code.coding-guidelines.com) will continue to work for at least a year, and probably longer.
A beta version of the new site is now running. If things check out (please let me know if you see any issues), https://shape-of-code.com will become the official home next weekend, and the DNS entry for shape-of-code.coding-guidelines.com will be changed to point to the new address.
The existing coding-guidelines.com website has been hosted by PowWeb since June 2005. These days few people will have heard of PowWeb, but in 2005 they often appeared in the list of top hosting sites. I have had a few problems over the years, but I suspect nothing that I would have experienced from other providers. Over time, the functionality provided by PowWeb has decreased, compared to what they used to offer and what others offer today. But since my site usage has been essentially hosting a blog, I have not had a reason to move.
While I have had a nagging feeling I ought to move to a major provider, it was not until a post caused the site to be taken off-line because of a page-views per-hour limit being exceeded, that I decided to move. The limit was exceeded because an article appeared on news.ycombinator and became more popular, more rapidly, than my previous article appearances on ycombinator (which have topped out at 20K+ hits). Customer support were very responsive and quickly reset the page counter, once I contacted them and explained the situation. But why didn’t they inform me (I rarely hear from them, apart from billing, and one false alarm about the site sending spam), and why no option to upgrade?
The screenshot below shows that the daily traffic is around 1K views (mostly from Google searches), with 20k+ daily peak views every few months (sometimes months after the article was posted):

Eight months later, the annual fee is due; time for action. HostGator is highly rated by many hosting reviews, and offered site migration (never having migrated a website before, I did not know it was essentially ftp’ing the contents, and maybe some basic WordPress stuff). I signed up.
As you may have guessed, my approach to website maintenance is: If it’s not broken, don’t fix it. This meant the site was running the oldest version of WordPress (4.2.30) and PHP (5.2, which reached end-of-life 10 years ago) that PowWeb supported.
As I learned about website and WordPress migration, I thought: I can do that. My Plan B was to get HostGator to do it.
WordPress migration turned out to be straight forward:
- export blog contents. WordPress generates an xml file,
- edit the xml file, replacing all occurrences of
shape-of-code.coding-guidelines.combyshape-of-code.com, - create WordPress blog on HostGator (to minimise the chance of incompatibilities I stayed with version 4, HostGator offers 4.9.18), selected a few options, and installed a few basic add-ons,
- ftp directories containing images and code+data to new site,
- import contents of xml file (there is a 512M limit, my file was 5.5M).
It worked 🙂
I was not happy with the theme visually closest to the current blog (Twenty Sixteen), so I tried installing the existing theme (iNove). Despite not being maintained for eight years, it works well enough for me to decide to run with it.
I’m hoping that the new site will run with minimal input from me (apart from writing articles) for the next 10-years.
Mutation testing: its days in the limelight are over
How good a job does a test suite do in detecting coding mistakes in the program it tests?
Mutation testing provides one answer to this question. The idea behind mutation testing is to make a small change to the source code of the program under test (i.e., introduce a coding mistake), and then run the test suite through the mutated program (ideally one or more tests fail, as-in different behavior should be detected); rinse and repeat. The mutation score is the percentage of mutated programs that cause a test failure.
While Mutation testing is 50-years old this year (although the seminal paper did not get published until 1978), the computing resources needed to research it did not start to become widely available until the late 1980s. From then, until fuzz testing came along, mutation testing was probably the most popular technique studied by testing researchers. A collected bibliography of mutation testing lists 417 papers and 16+ PhD thesis (up to May 2014).
Mutation testing has not been taken up by industry because it tells managers what they already know, i.e., their test suite is not very good at finding coding mistakes.
Researchers concluded that the reason industry had not adopted mutation testing was that it was too resource intensive (i.e., mutate, compile, build, and run tests requires successively more resources). If mutation testing was less resource intensive, then industry would use it (to find out faster what they already knew).
Creating a code mutant is not itself resource intensive, e.g., randomly pick a point in the source and make a random change. However, the mutated source may not compile, or the resulting mutant may be equivalent to one created previously (e.g., the optimised compiled code is identical), or the program takes ages to compile and build; techniques for reducing the build overhead include mutating the compiler intermediate form and mutating the program executable.
Some changes to the source are more likely to be detected by a test suite than others, e.g., replacing <= by > is more likely to be detected than replacing it by < or ==. Various techniques for context dependent mutations have been proposed, e.g., handling of conditionals.
While mutation researchers were being ignored by industry, another group of researchers were listening to industry's problems with testing; automatic test case generation took off. How might different test case generators be compared? Mutation testing offers a means of evaluating the performance of tools that arrived on the scene (in practice, many researchers and tool vendors cite statement or block coverage numbers).
Perhaps industry might have to start showing some interest in mutation testing.
A fundamental concern is the extent to which mutation operators modify source in a way that is representative of the kinds of mistakes made by programmers.
The competent programmer hypothesis is often cited, by researchers, as the answer to this question. The hypothesis is that competent programmers write code/programs that is close to correct; the implied conclusion being that mutations, which are small changes, must therefore be like programmer mistakes (the citation often given as the source of this hypothesis discusses data selection during testing, but does mention the term competent programmer).
Until a few years ago, most analysis of fixes of reported faults looked at what coding constructs were involved in correcting the source code, e.g., 296 mistakes in TeX reported by Knuth. This information can be used to generate a probability table for selecting when to mutate one token into another token.
Studies of where the source code was changed, to fix a reported fault, show that existing mutation operators are not representative of a large percentage of existing coding mistakes; for instance, around 60% of 290 source code fixes to AspectJ involved more than one line (mutations usually involve a single line of source {because they operate on single statements and most statements occupy one line}), another study investigating many more fixes found only 10% of fixes involved one line, and similar findings for a study of C, Java, Python, and Haskell (a working link to the data, which is a bit disjointed of a mess).
These studies, which investigated the location of all the source code that needs to be changed, to fix a mistake, show that existing mutation operators are not representative of most human coding mistakes. To become representative, mutation operators need to be capable of making coupled changes across multiple lines/functions/methods and even files.
While arguments over the validity of the competent programmer hypothesis rumble on, the need for multi-line changes remains.
Given the lack of any major use-cases for mutation testing, it does not look like it is worth investing lots of resources on this topic. Researchers who have spent a large chunk of their career working on mutation testing will probably argue that you never know what use-cases might crop up in the future. In practice, mutation research will probably fade away because something new and more interesting has come along, i.e., fuzz testing.
There will always be niche use-cases for mutation. For instance, how likely is it that a random change to the source of a formal proof will go unnoticed by its associated proof checker (i.e., the proof checking tool output remains unchanged)?
A study based on mutating the source of Coq verification projects found that 7% of mutations had no impact on the results.
Testing rounded data for a circular uniform distribution
Circular statistics deals with analysis of measurements made using a circular scale, e.g., minutes past the hour, days of the week. Wikipedia uses the term directional statistics, the traditional use being measurements of angles, e.g., wind direction.
Package support for circular statistics is rather thin on the ground. R’s circular package is one of the best, and the book “Circular Statistics in R” provides the only best introduction to the subject.
Circular statistics has a few surprises for those new to the subject (apart from a few name changes, e.g., the von Mises distribution is effectively the ‘circular Normal distribution’), including:
- the mean value contains two components, a direction and a length, e.g., mean wind direction and strength,
- there are several definitions of variance, with angular variance having a value between 0 and 2, and circular variance having a value between 0 and 1. The circular standard deviation is not the square root of variance, but rather:
 , where
  is the mean length.
The basic techniques used in circular statistics are still relatively new, compared to the more well known basic statistical techniques. For instance, it was recently discovered that having more measurements may reduce the reliability of the Rao spacing test (used to test whether a sample has a uniform circular distribution); generally, having more measurements improves the reliability of a statistical test.
The plot below shows Rose diagrams for the number of commits in each 3-hour period of a day for Linux and FreeBSD (mean direction and length in green; code+data):
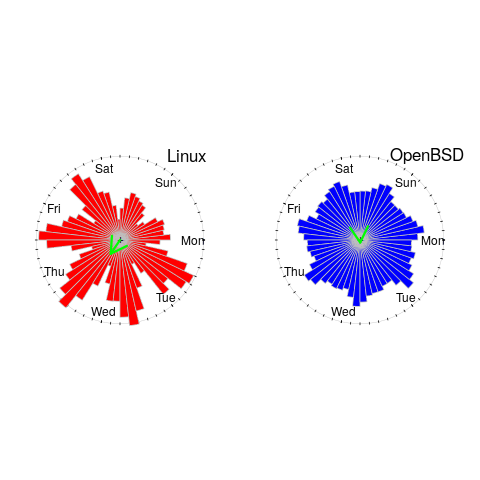
The Linux kernel source has far fewer commits at the weekend, compared to working days. Given the number of people whose job is to work on the Linux kernel, compared to the number of people doing it out of interest, this difference is not surprising. The percentage of people working on OpenBSD as a job is small, and there does not appear to be a big difference between weekends and workdays. There is a lot of variation in the number of commits during each 3-hour period of a day, but the number of commits per day does not vary so much; the number of OpenBSD commits per day of week is:
            Mon   Tue   Wed   Thu   Fri   Sat   Sun
26909 26144 25705 25104 24765 22812 24304 |
Does this distribution of commits per day have a uniform distribution (to some confidence level)?
Like all measurements, those made on a circular scale are rounded to some number of digits. Measurements may also be rounded, or binned, to particular units of the scale, e.g., measured to the nearest degree, or nearest minute.
A recent paper, by Landler, Ruxton and Malkemper, found that for samples containing around five hundred or more measurements, rounding to the nearest degree was sufficient to cause the Rao spacing test to almost always report non-uniformity, i.e., for non-trivial samples the rounding was sufficient to cause the test to detect non-uniformity (things worked as expected for samples containing fewer than 100 measurements).
Landler et al found that adding a small amount of noise (drawn from a von Mises distribution) to the rounded measurements appeared to ‘fix’ the incorrect behavior, i.e., rejecting the hypothesis of a uniform distribution, when a uniform distribution may be present.
The rao.spacing.test function, in the circular package, rejected that null hypothesis that the OpenBSD daily data has a uniform distribution. However, when noise is added to each day value (i.e., adding a random fraction to the day values, using rvonmises(length(c_per_day), circular(0), 2.0), although runif(length(c_per_day)) is probably more appropriate {and produces essentially the same result}), the call to rao.spacing.test failed to reject the null hypothesis of uniformity at the 0.05 level (i.e., the daily distribution is probably uniform).
How many research results are affected by this discovery?
I very rarely encounter the use of circular statistics (even though they should probably have been used in places), but then I spend my time reading software engineering papers, whose use of statistics tends to be primitive. I plan to include a brief mention of the use of the Rao spacing test with binned data in the addendum to my Evidence-based software engineering book (which includes the above example).
Recent Comments