Archive
A study of deceit when reporting information in a known context
A variety of conflicting factors intrude when attempting to form an impartial estimate of the resources needed to perform a task. The customer/manager, asking for the estimate, wants to hear a low value, creating business/social pressure to underestimate; overestimating increases the likelihood of completing the task within budget.
A study by Oey, Schachner and Vul investigated the strategic reasoning for deception/lying in a two-person game.
A game involved a Sender and Receiver, with the two players alternating between the roles. The game started with both subjects seeing a picture of a box containing red and blue marbles (the percentage of red marbles was either 20%, 50%, or 80%). Ten marbles were randomly selected from this ‘box’, and shown to the Sender. The Sender was asked to report to the Receiver the number of red marbles appearing in the random selection,  (there was an incentive to report higher/lower, and punishment for being caught being inaccurate). The Receiver could accept or reject the number of red balls reported by the Sender. In the actual experiment, unknown to the human subjects, one of every game’s subject pair was always played by a computer. Every subject played 100 games.
In the inflate condition: If the Receiver accepted the report, the Sender gained points, and the Receiver gained  points.
If the Receiver rejected the report, then:
- if the Sender’s report was accurate (i.e., ==
 ), the Sender gained points, and the Receiver gained
  points (i.e., a -5 point penalty),
 - if the Sender’s report was not accurate, the Receiver gained 5 points, and the Sender lost 5 points.
In the deflate condition: The points awarded to the Sender was based on the number of blue balls in the sample, and the points awarded to the Received was based on the number of red balls in the sample (i.e., the Sender had in incentive to report fewer red balls).
The plot below shows the mean rate of deceit (i.e., the fraction of a subject’s reports where  , averaged over all 116 subject’s mean) for a given number of red marbles actually seen by the Sender; vertical lines show one standard deviation, calculated over the mean of all subjects (code+data):
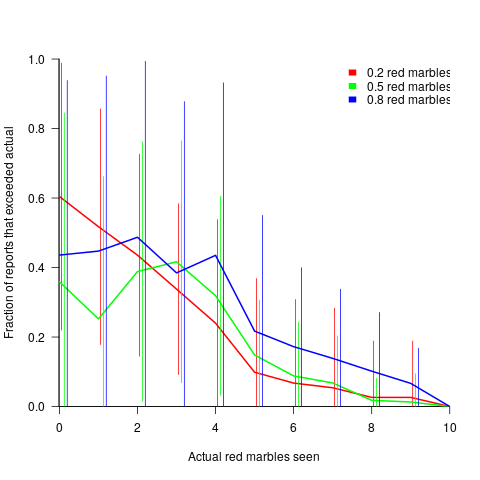
Subjects have some idea of the percentage of red/blue balls, and are aware that their opponent has a similar idea.
The wide variation in the fraction of reports where a subject reported a value greater than the number of marbles seen, is likely caused by variation in subject level of risk aversion. Some subjects may have decided to reduce effort by always accurately reporting, while others may have tried to see how much they could get away with.
The wide variation is particularly noticeable in the case of a box containing 80% red. If a Sender’s random selection contains few reds, then the Sender can feel confident reporting to have seen more.
The general pattern shows subjects being more willing to increase the reported number when they are supplied with few.
There is a distinct change of behavior when half of the sample contains more than five red marbles. In this situation, subjects may be happy to have been dealt a good hand, and are less inclined to risk losing 5-points for less gain.
Estimating involves considering more factors than the actual resources likely to be needed to implement the task; the use of round numbers is one example. This study is one of few experimental investigations of numeric related deception. The use of students having unknown motivation is far from ideal, but they are better than nothing.
When estimating in a team context, there is an opportunity to learn about the expectations of others and the consequences of over/under estimating. An issue for another study 🙂
Studying the lifetime of Open source
A software system can be said to be dead when the information needed to run it ceases to be available.
Provided the necessary information is available, plus time/money, no software ever has to remain dead, hardware emulators can be created, support libraries can be created, and other necessary files cobbled together.
In the case of software as a service, the vendor may simply stop supplying the service; after which, in my experience, critical components of the internal service ecosystem soon disperse and are forgotten about.
Users like the software they use to be actively maintained (i.e., there are one or more developers currently working on the code). This preference is culturally driven, in that we are living through a period in which most in-use software systems are actively maintained.
Active maintenance is perceived as a signal that the software has some amount of popularity (i.e., used by other people), and is up-to-date (whatever that means, but might include supporting the latest features, or problem reports are being processed; neither of which need be true). Commercial users like actively maintained software because it enables the option of paying for any modifications they need to be made.
Software can be a zombie, i.e., neither dead or alive. Zombie software will continue to work for as long as the behavior of its external dependencies (e.g., libraries) remains sufficiently the same.
Active maintenance requires time/money. If active maintenance is required, then invest the time/money.
Open source software has become widely used. Is Open source software frequently maintained, or do projects inhabit some form of zombie state?
Researchers have investigated various aspects of the life cycle of open source projects, including: maintenance activity, pull acceptance/merging or abandoned, and turnover of core developers; also, projects in niche ecosystems have been investigated.
The commits/pull requests/issues, of circa 1K project repos with lots of stars, is data that can be automatically extracted and analysed in bulk. What is missing from the analysis is the context around the creation, development and apparent abandonment of these projects.
Application areas and development tools (e.g., editor, database, gui framework, communications, scientific, engineering) tend to have a few widely used programs, which continue to be actively worked on. Some people enjoy creating programs/apps, and will start development in an area where there are existing widely used programs, purely for the enjoyment or to scratch an itch; rarely with the intent of long term maintenance, even when their project attracts many other developers.
I suspect that much of the existing research is simply measuring the background fizz of look-alike programs coming and going.
A more realistic model of the lifecycle of Open source projects requires human information; the intent of the core developers, e.g., whether the project is intended to be long-term, primarily supported by commercial interests, abandoned for a successor project, or whether events got in the way of the great things planned.
Clustering source code within functions
The question of how best to cluster source code into functions is a perennial debate that has been ongoing since functions were first created.
Beginner programmers are told that clustering code into functions is good, for a variety of reasons (none of the claims are backed up by experimental evidence). Structuring code based on clustering the implementation of a single feature is a common recommendation; this rationale can be applied at both the function/method and file/class level.
The idea of an optimal function length (measured in statements) continues to appeal to developers/researchers, but lacks supporting evidence (despite a cottage industry of research papers). The observation that most reported fault appear in short functions is a consequence of most of a program’s code appearing in short functions.
I have had to deal with code that has not been clustered into functions. When microcomputers took off, some businessmen taught themselves to code, wrote software for their line of work and started selling it. If the software was a success, more functionality was needed, and the businessman (never encountered a woman doing this) struggled to keep on top of things. A common theme was a few thousand lines of unstructured code in one function in a single file (keeping everything in one file is also a trait of highly focus developers).
Adding structural bureaucracy (e.g., functions and multiple files) reduced the effort needed to maintain and enhance the code.
The problem with ‘born flat’ source is that the code for unrelated functionality is often intermixed, and global variables are freely used to communicate state. I have seen the same problems in structured function code, but instances are nowhere near as pervasive.
When implementing the same program, do different developers create functions implementing essentially the same functionality?
I am aware of two datasets relating to this question: 1) when implementing the same small specification (average length program 46.3 lines), a surprising number of variants (6,301) are created, 2) an experiment that asked developers to reintroduce functions into ‘flattened’ code.
The experiment (Alexey Braver’s MSc thesis) took an existing Python program, ‘flattened’ it by inlining functions (parameters were replaced by the corresponding call arguments), and asked subjects to “… partition it into functions in order to achieve what you consider to be a good design.”
The 23 rows in the plot below show the start/end (green/brown delimited by blue lines) of each function created by the 23 subjects; red shows code not within a function, and right axis is percentage of each subjects’ code contained in functions. Blue line shows original (currently plotted incorrectly; patched original code+data):
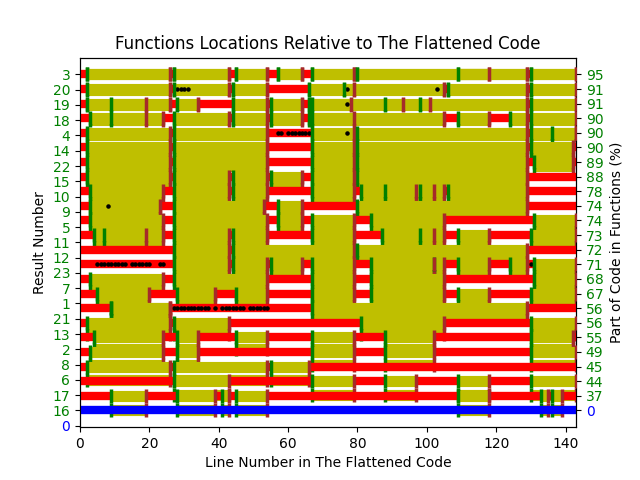
There are many possible reasons for the high level of agreement between subjects, including: 1) the particular example chosen, 2) the code was already well-structured, 3) subjects were explicitly asked to create functions, 4) the iterative process of discovering code that needs to be written did not occur, 5) no incentive to leave existing working code as-is.
Given that most source has a short and lonely existence, is too much time being spent bike-shedding function contents?
Given how often lower level design time happens at code implementation time, perhaps discussion of function contents ought to be viewed as more about thinking how things fit together and interact, than about each function in isolation.
Analyzing each function in isolation can create perverse incentives.
Printing press+widespread religious behavior: A theory
The book The Weirdest People in the World: How the West Became Psychologically Peculiar and Particularly Prosperous provides an explanation of the processes which weakened the existing social ties of family and tribe; however, the emergence of WEIRD people (Western, Educated, Industrialized, Rich and Democratic) required new social norms to spread and be accepted throughout society. A major technical innovation, in the form of the printing press, provided the means for mass communication of ideas and practices.
David High-Jones’ book Wyclif’s Dust: Western Cultures from the Printing Press to the Present describes the social consequences of what he calls book religion; a combination of deeply religious western societies and the ability of individuals to write and sell affordable books (made possible by the printing press). Religion+printing press created the conditions for what High-Jones calls a hothouse culture, a period from the 1600s to the end of the 1800s.
Around 1440 the printing press is invented and quickly spreads; around 5 million books were handwritten in the 1400s, about 80 million books were produced in the first 50 years of printing, and around a billion in the 1700s. During the 1500s the Protestant reformation happens; Protestant encouraged its followers to read the Bible, which creates a demand for printed Bibles and the need to be able to read (which increases literacy rates). In England, between 1480-1640, 40% of published books were religious.
The changes to society’s existing norms are wrought by cultural transmission, initially via middle class parents making use of edifying books to teach their children moral values and social skills, later Sunday schools took on this role, but also had to offer reading lessons to attract members. In the adult world, accepted norms were maintained by social enforcement. The impact on western societies was widespread because observant religious behavior was widespread.
The original intent, of those writing the religious books, was the creation of a god fearing society. In practice, a trust based society was created, where workers might be relied upon not to shirk their duties and businessmen to not renege on agreements.
In the beginning science, in the form of printed technical books, rarely made an appearance. In the 1700s the Enlightenment happens, and scientific books are discussed by small collections of disparate individuals. The industrial revolution happens, but the bulk of the demand is for trustworthy workers; technical and scientific know how remains a minority interest.
In Part I of the book, High-Jones weaves a reading and convincing narrative. Part II, 1900 to today, is a tale of the crumbling and breakdown of the social forces and incentives that creates the trust based society; while example are enumerated, no overarching theory is proposed (I skimmed this part).
Shopper estimates of the total value of items in their basket
Agile development processes break down the work that needs to be done into a collection of tasks (which may be called stories or some other name). A task, whose implementation time may be measured in hours or a few days, is itself composed of a collection of subtasks (which may in turn be composed of subsubtasks, and so on down).
When asked to estimate the time needed to implement a task, a developer may settle on a value by adding up estimates of the effort needed to implement the subtasks thought to be involved. If this process is performed in the mind of the developer (i.e., not by writing down a list of subtask estimates), the accuracy of the result may be affected by the characteristics of cognitive arithmetic.
Humans have two cognitive systems for processing quantities, the approximate number system (which has been found to be present in the brain of many creatures), and language. Researchers studying the approximate number system often ask subjects to estimate the number of dots in an image; I recently discovered studies of number processing that used language.
In a study by Benjamin Scheibehenne, 966 shoppers at the checkout counter in a grocery shop were asked to estimate the total value of the items in their shopping basket; a subset of 421 subjects were also asked to estimate the number of items in their basket (this subset were also asked if they used a shopping list). The actual price and number of items was obtained after checkout.
There are broad similarities between shopping basket estimation and estimating task implementation time, e.g., approximate idea of number of items and their cost. Does an analysis of the shopping data suggest ideas for patterns that might be present in software task estimate data?
The left plot below shows shopper estimated total item value against actual, with fitted regression line (red) and estimate==actual (grey); the right plot shows shopper estimated number of items in their basket against actual, with fitted regression line (red) and estimate==actual (grey) (code+data):
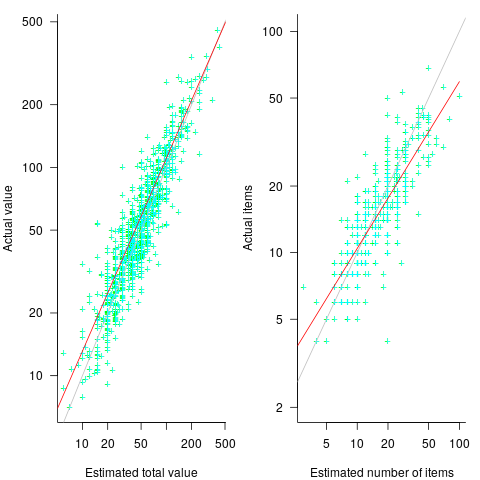
The model fitted to estimated total item value is:  , which differs from software task estimates/actuals in always underestimating over the range measured; the exponent value,
  , is at the upper range of those seen for software task estimates.
The model fitted to estimated number of items in the basket is:  . This pattern, of underestimating small values and overestimating large values is seen in software task estimation, but the exponent of
  is much smaller.
Including the estimated number of items in the shopping basket,  , in a model for total value produces a slightly better fitting model:
  , which explains 83% of the variance in the data (use of a shopping list had a relatively small impact).
The accuracy of a software task implementation estimate based on estimating its subtasks dependent on identifying all the subtasks, or having a good enough idea of the number of subtasks. The shopping basket study found a pattern of inaccuracies in estimates of the number of recently collected items, which has been seen before. However, adding to the Shopping model only reduced the unexplained variance by a few percent.
Would the impact of adding an estimate of the number of subtasks to models of software task estimates also only be a few percent? A question to add to the already long list of unknowns.
Like task estimates, round numbers were often given as estimate values; see code+data.
The same study also included a laboratory experiment, where subjects saw a sequence of 24 numbers, presented one at a time for 0.5 seconds each. At the end of the sequence, subjects were asked to type in their best estimate of the sum of the numbers seen (other studies asked subjects to type in the mean). Each subject saw 75 sequences, with feedback on the mean accuracy of their responses given after every 10 sequences. The numbers were described as the prices of items in a shopping basket. The values were drawn from a distribution that was either uniform, positively skewed, negatively skewed, unimodal, or bimodal. The sequential order of values was either increasing, decreasing, U-shaped, or inversely U-shaped.
Fitting a regression model to the lab data finds that the distribution used had very little impact on performance, and the sequence order had a small impact; see code+data.
Recent Comments