Archive
Growth in number of packages for widely used languages
These days a language’s ecosystem of add-ons, such as packages, is often more important than the features provided by the language (which usually only vary in their syntactic sugar, and built-in support for some subset of commonly occurring features).
Use of a particular language grows and shrinks, sometimes over very many decades. Estimating the number of users of a language is difficult, but a possible proxy is ecosystem activity in the form of package growth/decline. However, it will take many several decades for the data needed to test how effective this proxy might be.
Where are we today?
The Module Counts website is the home for a project that counts the number of libraries/packages/modules contained in 26 language specific repositories. Daily data, in some cases going back to 2010, is available as a csv 🙂 The following are the most interesting items I discovered during a fishing expedition.
The csv file contains totals, and some values are missing (which means specifying an ‘ignore missing values’ argument to some functions). Some repos have been experiencing large average daily growth (e.g., 65 for PyPI, and 112 for Maven Central-Java), while others are more subdued (e.g., 0.7 for PERL and 3.9 for R’s CRAN). Apart from a few days, the daily change is positive.
Is the difference in the order of magnitude growth due to number of active users, number of packages that currently exist, a wide/narrow application domain (Python is wide, while R’s is narrow), the ease of getting a package accepted, or something else?
The plots below show how PyPI has been experiencing exponential growth of a kind (the regression model fitted to the daily total has the form  , where
  is the number of days since 2010-01-01; the red line is the daily diff of this equation), while Ruby has been experiencing a linear decline since late 2014 (all code+data):

Will the five-year decline in new submissions to Rubygems continue, and does this point to an eventual demise of Ruby (a few decades from now)? Rubygems has years to go before it reaches PERL’s low growth rate (I think PERL is in terminal decline).
Are there any short term patterns, say at the weekly level? Autocorrelation is a technique for estimating the extent to which today’s value is affected by values from the immediate past (usually one or two measurement periods back, i.e., yesterday or the day before that). The two plots below show the autocorrelation for daily changes, with lag in days:
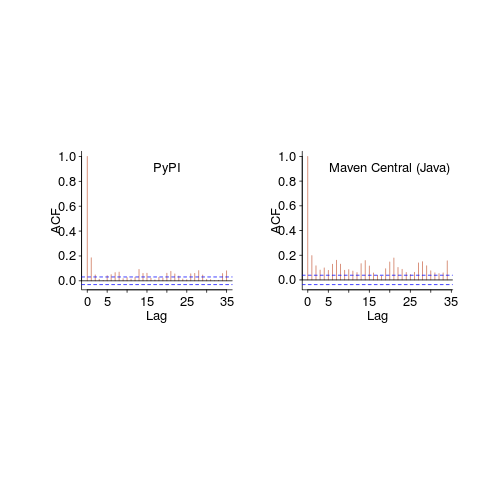
The recurring 7-day ‘peaks’ show the impact of weekends (I assume). Is the larger ”weekend-effect’ for Java, compared to PyPI, due to Java usage including a greater percentage of commercial developers (who tend not to work at the weekend)?
I did not manage to find any seasonal effect, e.g., more submissions during the winter than the summer. But I only checked a few of the languages, and only for a single peak (see code for details).
Another way of tracking package evolution is version numbering. For instance, how often do version numbers change, and which component, e.g., major/minor. There have been a couple of studies looking at particular repos over a few years, but nobody is yet recording broad coverage daily, over the long term 😉
Payback time-frame for research in software engineering
What are the major questions in software engineering that researchers should be trying to answer?
A high level question whose answer is likely to involve life, the universe, and everything is: What is the most cost-effective way to build software systems?
Viewing software engineering research as an attempt to find the answer to a big question mirrors physicists quest for a Grand Unified Theory of how the Universe works.
Physicists have the luxury of studying the Universe at their own convenience, the Universe does not need their input to do a better job.
Software engineering is not like physics. Once a software system has been built, the resources have been invested, and there is no reason to recreate it using a more cost-effective approach (the zero cost of software duplication means that manufacturing cost is the cost of the first version).
Designing and researching new ways of building software systems may be great fun, but the time and money needed to run the realistic experiments needed to evaluate their effectiveness is such that they are unlikely to be run. Searching for more cost-effective software development techniques by paying to run the realistic experiments needed to evaluate them, and waiting for the results to become available, is going to be expensive and time-consuming. A theory is proposed, experiments are run, results are analysed; rinse and repeat until a good-enough cost-effective technique is found. One iteration will take many years, and this iterative process is likely to take many decades.
Very many software systems are being built and maintained, and each of these is an experiment. Data from these ‘experiments’ provides a cost-effective approach to improving existing software engineering practices by studying the existing practices to figure out how they work (or don’t work).
Given the volume of ongoing software development, most of the payback from any research investment is likely to occur in the near future, not decades from now; the evidence shows that source code has a short and lonely existence. Investing for a payback that might occur 30-years from now makes no sense; researchers I talk to often use this time-frame when I ask them about the benefits of their research, i.e., just before they are about to retire. Investing in software engineering research only makes economic sense when it is focused on questions that are expected to start providing payback in, say, 3-5 years.
Who is going to base their research on existing industry practices?
Researching existing practices often involves dealing with people issues, and many researchers in computing departments are not that interested in the people side of software engineering, or rather they are more interested in the computer side.
Algorithm oriented is how I would describe researchers who claim to be studying software engineering. I am frequently told about the potential for huge benefits from the discovery of more efficient algorithms. For many applications, algorithms are now commodities, i.e., they are good enough. Those with a career commitment to studying algorithms have a blinkered view of the likely benefits of their work (most of those I have seen are doing studying incremental improvements, and are very unlikely to make a major break through).
The number of researchers studying what professional developers do, with an aim to improving it, is very small (I am excluding the growing number of fake researchers doing surveys). While I hope there will be a significant growth in numbers, I’m not holding my breadth (at least in the short term; as for the long term, Planck’s experience with quantum mechanics was: “Science advances one funeral at a time”).
Software effort estimation is mostly fake research
Effort estimation is an important component of any project, software or otherwise. While effort estimation is something that everybody in industry is involved with on a regular basis, it is a niche topic in software engineering research. The problem is researcher attitude (e.g., they are unwilling to venture into the wilds of industry), which has stopped them acquiring the estimation data needed to build realistic models. A few intrepid people have risked an assault on their ego and talked to people in industry, the outcome has been, until very recently, a small collection of tiny estimation datasets.
In a research context, the term effort estimation is actually a hang over from the 1970s; effort correction more accurately describes the behavior of most models since the 1990s. In the 1970s, models took various quantities (e.g., estimated lines of code) and calculated an effort estimate. Later models have included an estimate as input to the model, producing a corrected estimate as output. For the sake of appearances, I will use existing terminology.
Which effort estimation datasets do researchers tend to use?
A 2012 review of datasets used for effort estimation using machine learning between 1991-2010, found that the top three were: Desharnias with 24 papers (29%), COCOMO with 19 papers (23%) and ISBSG with 17. A 2019 review of datasets used for effort estimation using machine learning between 1991 and 2017, found the top three to be NASA with 17 papers (23%), the COCOMO data and ISBSG were joint second with 16 papers (21%), and Desharnais was third with 14. The 2012 review included more sources in its search than the 2019 review, and subjectively your author has noticed a greater use of the NASA dataset over the last five years or so.
How large are these datasets that have attracted so many research papers?
The NASA dataset contains 93 rows (that is not a typo, there is no power-of-ten missing), COCOMO 63 rows, Desharnais 81 rows, and ISBSG is licensed by the International Software Benchmarking Standards Group (academics can apply for a limited time use for research purposes, i.e., not pay the $3,000 annual subscription). The China dataset contains 499 rows, and is sometimes used (there is no mention of a supercomputer being required for this amount of data ;-).
Why are researchers involved in software effort estimation feeding tiny datasets from the 1980s-1990s into machine learning algorithms?
Grant money. Research projects are more likely to be funded if they use a trendy technique, and for the last decade machine learning has been the trendiest technique in software engineering research. What data is available to learn from? Those estimation datasets that were flogged to death in the 1990s using non-machine learning techniques, e.g., regression.
Use of machine learning also has the advantage of not needing to know anything about the details of estimating software effort. Everything can be reduced to a discussion of the machine learning algorithms, with performance judged by a chosen error metric. Nobody actually looks at the predicted estimates to discover that the models are essentially producing the same answer, e.g., one learner predicts 43 months, 2 weeks, 4 days, 6 hours, 47 minutes and 11 seconds, while a ‘better’ fitting one predicts 43 months, 2 weeks, 2 days, 6 hours, 27 minutes and 51 seconds.
How many ways are there to do machine learning on datasets containing less than 100 rows?
A paper from 2012 evaluated the possibilities using 9-learners times 10 data-preprocessing options (e.g., log transform or discretization) times 7-error estimation metrics giving 630 possible final models; they picked the top 10 performers.
This 2012 study has not stopped researchers continuing to twiddle away on the option’s nobs available to them; anything to keep the paper mills running.
To quote the authors of one review paper: “Unfortunately, we found that very few papers (including most of our own) paid any attention at all to properties of the data set.”
Agile techniques are widely used these days, and datasets from the 1990s are not applicable. What datasets do researchers use to build Agile effort estimation models?
A 2020 review of Agile development effort estimation found 73 papers. The most popular data set, containing 21 rows, was used by nine papers. Three papers used simulated data! At least some authors were going out and finding data, even if it contains fewer rows than the NASA dataset.
As researchers in business schools have shown, large datasets can be obtained from industry; ISBSG actively solicits data from industry and now has data on 9,500+ projects (as far as I can tell a small amount for each project, but that is still a lot of projects).
Are there any estimates on GitHub? Some Open source projects use JIRA, which includes support for making estimates. Some story point estimates can be found on GitHub, but the actuals are missing.
A handful of researchers have obtained and released estimation datasets containing thousands of rows, e.g., the SiP dataset contains 10,100 rows and the CESAW dataset contains over 40,000 rows. These datasets are generally ignored, perhaps because when presented with lots of real data, researchers have no idea what to do with it.
My new kitchen clock
After several decades of keeping up with the time, since November my kitchen clock has only been showing the correct time every 12-hours. Before I got to buy a new one, I was asked what I wanted to Christmas, and there was money to spend 🙂
Guess what Santa left for me:

The Hermle Ravensburg is a mechanical clock, driven by the pull of gravity on a cylindrical 1kg of Iron (I assume).
Setup requires installing the energy source (i.e., hang the cylinder on one end of a chain), attach clock to a wall where there is enough distance for the cylinder to slowly ‘fall’, set the time, add energy (i.e., pull the chain so the cylinder is at maximum height), and set the pendulum swinging.
The chain is long enough for eight days of running. However, for the clock to be visible from outside my kitchen I had to place it over a shelf, and running time is limited to 2.5 days before energy has to be added.
The swinging pendulum provides the reference beat for the running of the clock. The cycle time of a pendulum swing is proportional to the square root of the distance of the center of mass from the pivot point. There is an adjustment ring for fine-tuning the swing time (just visible below the circular gold disc of the pendulum).
I used my knowledge of physics to wind the center of mass closer to the pivot to reduce the swing time slightly, overlooking the fact that the thread on the adjustment ring moved a smaller bar running through its center (which moved in the opposite direction when I screwed the ring towards the pivot). Physics+mechanical knowledge got it right on the next iteration.
I have had the clock running 1-second per hour too slow, and 1-second per hour too fast. Current thinking is that the pendulum is being slowed slightly when the cylinder passes on its slow fall (by increased air resistance). Yes dear reader, I have not been resetting the initial conditions before making a calibration run 😐
What else remains to learn, before summer heat has to be adjusted for?
While the clock face and hands may be great for attracting buyers, it has serious usability issues when it comes to telling the time. It is difficult to tell the time without paying more attention than normal; without being a few feet from the clock it is not possible to tell the time by just glancing at it. The see though nature of the face, the black-on-black of the end of the hour/minute hands, and the extension of the minute hand in the opposite direction all combine to really confuse the viewer.
A wire cutter solved the minute hand extension issue, and yellow fluorescent paint solved the black-on-black issue. Ravensburg clock with improved user interface, framed by faded paint of its predecessor below:

There is a discrete ting at the end of every hour. This could be slightly louder, and I plan to add some weight to the bell hammer. Had the bell been attached slightly off center, fine volume adjustment would have been possible.
Likelihood of a fault experience when using the Horizon IT system
It looks like the UK Post Office’s Horizon IT system is going to have a significant impact on the prosecution of cases that revolve around the reliability of software systems, at least in the UK. I have discussed the evidence illustrating the fallacy of the belief that “most computer error is either immediately detectable or results from error in the data entered into the machine.” This post discusses what can be learned about the reliability of a program after a fault experience has occurred, or alleged to have occurred in the Horizon legal proceedings.
Sub-postmasters used the Horizon IT system to handle their accounts with the Post Office. In some cases money that sub-postmasters claimed to have transferred did not appear in the Post Office account. The sub-postmasters claimed this was caused by incorrect behavior of the Horizon system, the Post Office claimed it was due to false accounting and prosecuted or fired people and sometimes sued for the ‘missing’ money (which could be in the tens of thousands of pounds); some sub-postmasters received jail time. In 2019 a class action brought by 550 sub-postmasters was settled by the Post Office, and the presiding judge has passed a file to the Director of Public Prosecutions; the Post Office may be charged with instituting and pursuing malicious prosecutions. The courts are working their way through reviewing the cases of the sub-postmasters charged.
How did the Post Office lawyers calculate the likelihood that the missing money was the result of a ‘software bug’?
Horizon trial transcript, day 1, Mr De Garr Robinson acting for the Post Office: “Over the period 2000 to 2018 the Post Office has had on average 13,650 branches. That means that over that period it has had more than 3 million sets of monthly branch accounts. It is nearly 3.1 million but let’s call it 3 million and let’s ignore the fact for the first few years branch accounts were weekly. That doesn’t matter for the purposes of this analysis. Against that background let’s take a substantial bug like the Suspense Account bug which affected 16 branches and had a mean financial impact per branch of £1,000. The chances of that bug affecting any branch is tiny. It is 16 in 3 million, or 1 in 190,000-odd.”
That 3.1 million comes from the calculation: 19-year period times 12 months per year times 13,650 branches.
If we are told that 16 events occurred, and that there are 13,650 branches and 3.1 million transactions, then the likelihood of a particular transaction being involved in one of these events is 1 in 194,512.5. If all branches have the same number of transactions, the likelihood of a particular branch being involved in one of these 16 events is 1 in 853 (13650/16 -> 853); the branch likelihood will be proportional to the number of transactions it performs (ignoring correlation between transactions).
This analysis does not tell us anything about the likelihood that 16 events will occur, and it does not tell us anything about whether these events are the result of a coding mistake or fraud.
We don’t know how many of the known 16 events are due to mistakes in the code and how many are due to fraud. Let’s ask: What is the likelihood of one fault experience occurring in a software system that processes a total of 3.1 million transactions (the number of branches is not really relevant)?
The reply to this question is that it is not possible to calculate an answer, because all the required information is not specified.
A software system is likely to contain some number of coding mistakes, and given the appropriate input, any of these mistakes may produce a fault experience. The information needed to calculate the likelihood of one fault experience occurring is:
- the number of coding mistakes present in the software system,
- for each coding mistake, the probability that an input drawn from the distribution of input values produced by users of the software will produce a fault experience.
Outside of research projects, I don’t know of any anyone who has obtained the information needed to perform this calculation.
The Technical Appendix to Judgment (No.6) “Horizon Issues” states that there were 112 potential occurrences of the Dalmellington issue (paragraph 169), but does not list the number of transactions processed between these ‘issues’ (which would enable a likelihood to be estimated for that one coding mistake).
The analysis of the Post Office expert, Dr Worden, is incorrect in a complicated way (paragraphs 631 through 635). To ‘prove’ that the missing money was very unlikely to be the result of a ‘software bug’, Dr Worden makes a calculation that he claims is the likelihood of a particular branch experiencing a ‘bug’ (he makes the mistake of using the number of known events, not the number of unknown possible events). He overlooks the fact that while the likelihood of a particular branch experiencing an event may be small, the likelihood of any one of the branches experiencing an event is 13,630 times higher. Dr Worden’s creates complication by calculating the number of ‘bugs’ that would have to exist for there to be a 1 in 10 chance of a particular branch experiencing an event (his answer is 50,000), and then points out that 50,000 is such a large number it could not be true.
As an analogy, let’s consider the UK National Lottery, where the chance of winning the Thunderball jackpot is roughly 1 in 8-million per ticket purchased. Let’s say that I bought a ticket and won this week’s jackpot. Using Dr Worden’s argument, the lottery could claim that my chance of winning was so low (1 in 8-million) that I must have created a counterfeit ticket; they could even say that because I did not buy 0.8 million tickets, I did not have a reasonable chance of winning, i.e., a 1 in 10 chance. My chance of winning from one ticket is the same as everybody else who buys one ticket, i.e., 1 in 8-million. If millions of tickets are bought, it is very likely that one of them will win each week. If only, say, 13,650 tickets are bought each week, the likelihood of anybody winning in any week is very low, but eventually somebody will win (perhaps after many years).
The difference between the likelihood of winning the Thunderball jackpot and the likelihood of a Horizon fault experience is that we have enough information to calculate one, but not the other.
The analysis by the defence team produced different numbers, i.e., did not conclude that there was not enough information to perform the calculation.
Is there any way that the information needed to calculate the likelihood of a fault experience occurring?
In theory fuzz testing could be used. In practice this is probably completely impractical. Horizon is a data driven system, and so a copy of the database would need to be used, along with a copy of all the Horizon software. Where is the computer needed to run this software+database? Yes, use of the Post Office computer system would be needed, along with all the necessary passwords.
Perhaps, if we wait long enough, a judge will require that one party make all the software+database+computer+passwords available to the other party.
What impact might my evidence-based book have in 2021?
What impact might the release of my evidence-based software engineering book have on software engineering in 2021?
Lots of people have seen the book. The release triggered a quarter of a million downloads, or rather it getting linked to on Twitter and Hacker News resulted in this quantity of downloads. Looking at the some of the comments on Hacker News, I suspect that many ‘readers’ did not progress much further than looking at the cover. Some have scanned through it expecting to find answers to a question that interests them, but all they found was disconnected results from a scattering of studies, i.e., the current state of the field.
The evidence that source code has a short and lonely existence is a gift to those seeking to save time/money by employing a quick and dirty approach to software development. Yes, there are some applications where a quick and dirty iterative approach is not a good idea (iterative as in, if we make enough money there will be a version 2), the software controlling aircraft landing wheels being an obvious example (if the wheels don’t deploy, telling the pilot to fly to another airport to see if they work there is not really an option).
There will be a few researchers who pick up an idea from something in the book, and run with it; I have had a couple of emails along this line, mostly from just starting out PhD students. It would be naive to think that lots of researchers will make any significant changes to their existing views on software engineering. Planck was correct to say that science advances one funeral at a time.
I’m hoping that the book will produce a significant improvement in the primitive statistical techniques currently used by many software researchers. At the moment some form of Wilcoxon test, invented in 1945, is the level of statistical sophistication wielded in most software engineering papers (that do any data analysis).
Software engineering research has the feeling of being a disjoint collection of results, and I’m hoping that a few people will be interested in starting to join the dots, i.e., making connections between findings from different studies. There are likely to be a limited number of major dot joinings, and so only a few dedicated people are needed to make it happen. Why hasn’t this happened yet? I think that many academics in computing departments are lifestyle researchers, moving from one project to the next, enjoying the lifestyle, with little interest in any research results once the grant money runs out (apart from trying to get others to cite it). Why do I think this? I have emailed many researchers information about the patterns I have found in the data they sent me, and a common response is almost completely disinterest (some were interested) in any connections to other work.
What impact do you think ‘all’ the evidence presented will have?
Recent Comments