Archive
Program to extract x/y coordinates of points in pdf graphs
There are two techniques for specifying the display information contained in any graph within a pdf file. Raster graphics specifies (e.g., jpeg and png formats) the location and color of pixels, and vector graphics specifies (e.g., pdf and svg) the x/y coordinates of shapes/colors on the page. With vector graphics it’s possible to calculate the graph-axis relative positions of displayed symbols using the page relative x/y positions of each symbol (denoting a measurement point), the graph axis and axis tick marks/values; something I first did out in 2013. My Evidence-base software engineering book contains 10+ datasets that have been manually extracted from vector graphics within pdf files, i.e., by writing a graph specific awk script (a summary of the processes and tools used).
Can coding agents be used to implement a program detects and extracts the x/y coordinates (axis relative) of data points in any graphs, implemented using vector graphics, contained in a pdf file?
Do LLMs know of any tools that already do this? No.
This weekend I attended the Reinvent the Wheel: A Tools for Science Hack, where attendees were given credits for a month of Claude Max (these days I don’t write enough code to make it worth spending more than $20 per month on subscriptions). This was a perfect opportunity, and motivation, to create a specification of the data point x/y coordinate extraction process, and then to attempt to get a coding agent to generate a python program that extracted this data from any pdf file (whose plots were created using vector graphics).
Data points within a graph are drawn using a variety of symbols, and the symbols are drawn using a variety of techniques. For instances, a circle might be drawn using a single internal pdf instruction, drawing four quadrants using Bézier curves, or even eight Bézier curves, or who knows what (it’s very frustrating).
Then there are the tick marks along the axis, some of which are labelled with numeric values, don’t always start/finish at the ends of the axis, and denote a scale that could be linear or logarithmic.
My plan was to specify what was required, briefly describe the internal organization of a pdf file, provide a pdf file containing a single graph and the corresponding extracted data, as a csv file, and see what happens.
The start of my conversation with Claude Opus 5.5 follows:
Write a python program that takes as input a pdf file and outputs the x/y coordinates of individual data points displayed using vector graphics. The vector graphics, as specified by internal pdf instructions, used to display these data points appear on lines bracketed by lines that just contain the words "stream" and "endstream" The data points appear within a graph displayed on a page. This graph contains an x and y axis and may contain other unrelated lines and text within the plot's x/y axis. The required x/y data point coordinates must be relative to the values displayed on the plot's x and y axis. Each x and y axis is drawn as one long line and short tick marks for particular axis values. An internal instruction is used to display a numeric value close to its associated tick mark. Various symbols may be used to display each data point. For instance, in the attached pdf file a data point is denoted by a circle created by joining four bezier curves. The required x/y coordinate is at the center of the approximate circle drawn by these four bezier curves. All data point coordinates must be output, even data points having the same x/y coordinates as other data points. The attached file schump.tgz contains a pdf file and a csv file containing the internal x/y positions of the data points and the corresponding graph relative x/y positions, it also contains the page number and the color of the data points. Each graph is numbered. |
It took about 15 minutes to create a python program that extracted the information from the pdf file that matched the contents of the csv file. I was impressed.
The generated program was then extended one feature at a time by describing some possible characteristics of a graph, and attaching a pdf containing a graph containing those characteristics; for instance (another 15-20 minutes):
Extend the program to support data points displayed as a diamond shape created by drawing four lines. The attached file 53cfc681e8e2afa9feb5820f4886e3018005-009.pdf is a pdf file. The data points are denoted by diamonds created by drawing four short lines. |
This one/two feature at a time iteration looped six or so times before I grouped the remaining features into one update. Two+ hours later Claude provided 4K+ LOC of python code that appeared to handle everything.
The most impressive behavior was spotting minor issues that I had not mentioned and supporting them, or asking if they should be supported.
The pdfgraph2csv GitHub repo contains the code + regression tests.
Is the information in the output csv files correct?
The x/y coordinates of the points in the graphs in my book are available to be checked against. I also plan to repeat the process using a coding agent from another vendor, and to compare the contents of the corresponding csv files. N-version programming, here we come.
LLM handling of programming language differences
LLMs are trained on the publicly available source code, with no consideration given to the programming language used. There is an implicit assumption that training on code written in X and Y, rather than just Y, produces an LLM that does a better job of generating code written in Y.
To what extent will the characteristics of the training data from language X source ‘leak’ into source code generated for language Y?
LLM source generation is a very new field and significant improvements are still being made to models and agent harnesses. This article lists some issues, and checks how a few models handle them.
It would be great to have lots of LLM generated code to measure, and there are a few collections of LLM generated code. However, reliably distinguishing human from LLM generated code is an open problem. A 2025 study of Python source generated by multiple LLMs found that it was not possible to reliably predict human/LLM authorship (which suggests that LLM source datasets collected using authorship prediction are likely to be unreliable). The characteristics of a dataset of individual functions are unlikely to have the same distribution as a dataset of complete programs.
Some language usage behaviours are the result of the widespread adoption of particular conventions, and from the program correctness perspective these differences are harmless (e.g., source indentation), while others are semantic differences that could produce different output.
While patterns caused by coding conventions might not change
program output, they can change its performance characteristics (e.g., larger functions can alter cache occupancy), and some of these patterns are input to mathematical models of program evolution, e.g., distribution of method size (in LOC) is a factor in modelling the percentage of methods containing no reported faults.
The plot below shows the percentage of C/C++ (same behavior) and Java functions/methods containing a given number of lines (data recently extracted using CodeQL’s variant analysis of 100 C/C++ and Java projects, with 1,094,911 C++ functions, 328,009 C functions and 4,506,326 Java methods; code+data):
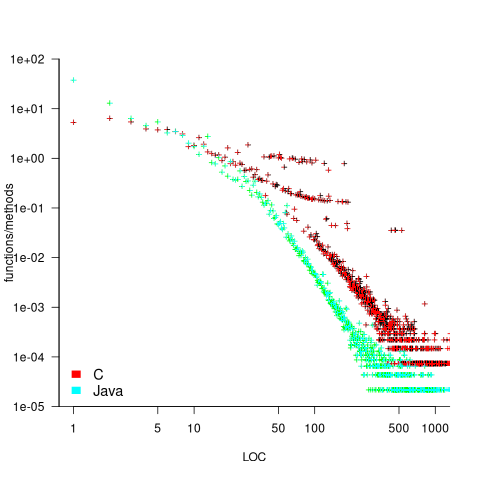
The large number of 1-line Java methods is assumed to be due to the widespread use of getters/setters. For the most common function/method sizes (i.e. 1 to 10 lines), have C and Java very different distributions, but follow a very similar power law for more than around 50 lines. Will LLM generate code contain this C/Java size difference, or will it have a completely different distribution (coding agents do seem to generate more code)?
Pre-object-oriented algorithmic languages can be classified into two families, those influenced by Fortran and those influenced by C.
In Fortran arrays are 1-based, while in C they are 0-based. The base-value for arrays is common knowledge, which LLMs handle. The more obscure differences, which rarely occur in source, are more likely to be overlooked.
Fortran and C have differences in operator precedence. The significant difference is the relative precedence of the unary not operator, and the binary equality/relational operators. The expression: ! x == y is equivalent to .not. (x == y) in Fortran, and equivalent to: (!x) == y in C. When asked to convert a C function containing the unbracketed form of the expression to Fortran, both Grok 4.6 and ChatGPT 5.5 note the different operator precedence and insert the appropriate parenthesis.
Both C and Python are popular languages with huge quantities of source publicly available. The token sequence: x < y == y, is parsed as: (x < y) == y in C, but in Python it is parsed as: (x < y) and (y == y). Both Grok and ChatGPT note the different operator precedence and insert the appropriate parenthesis.
There are a variety of differences between C and C++. However, source containing occurrences of all but two of them will produce a compile time error.
The following difference is known in compiler writer circles, and both Grok and ChatGPT note the different possible behaviors:
template_name < a , b > - 5 // equivalent to (template_name < a , b >) - 5) non_template_name < a , b > - 5 // equivalent to (non_template_name < a) , (b > - 5) |
The C/C++ difference that is much more likely to be encountered is the expression sizeof('a'), where C promotes the character 'a' to an int (which commonly has size 4; on DSP processors char often occupies the same number of bits as an int, giving both of them a size of 1), while C++ 'a' has type char (which is defined to have size 1).
There are sometimes behavior differences, for the same source, between versions of the same language specification. For instance, the following somewhat obscure difference between the C90, C99, and C11 language standards:
#include <stdio.h> #define M(U) sizeof(U"s"[0]) int main(void) { switch(M("")*2 //**/ 2 ) { case 1: printf("C90\n"); break; case 2: printf("C99\n"); break; case 8: printf("C11\n"); break; } } |
When asked what this program outputs, ChatGPT only considers C11, and 'corrects' itself after I pointed out the C90 lexical behavior. Grok only considers the latest standard, and when asked about producing other outputs, runs gcc with various -std options to find the other cases.
Both LLMs used (Grok 4.6 and ChatGPT 5.5) handled all the language differences I tried. Will cheaper to use coding agents, using LLMs containing an order of magnitude fewer parameters, be as effective at handling obscure differences? We will have to wait and see.
Distribution of method chains in Java and Python
Some languages support three different ways of organizing a sequence of functions/methods, with calls taking as their first argument the value returned by the immediately prior call. For instance, Java supports the following possibilities:
r1=f1(val); r2=f2(r1); r3=f3(r2); // Sequential calls r3=f3(f2(f1(val))); // Nested calls, read right to left r3=val.f1().f2().f3(); // Method chain, read left to right |
Simula 67 was the first language to support the dot-call syntax used to code method chains. Ten years later Smalltalk-76 supported sending a message to the result of a prior send, which could be seen as a method chain rather than a nested call (because it is read left to right; Smalltalk makes minimal use of punctuator characters, so the syntax is not distinguishable).
How common are method chains in source code, and what is the distribution of chain length? Two studies have investigated this question: An Empirical Study of Method Chaining in Java by Nakamaru (PhD thesis), Matsunaga, Akiyama, Yamazaki, and Chiba, and Method Chaining Redux: An Empirical Study of Method Chaining in Java, Kotlin, and Python by Keshk, and Dyer.
The plot below shows the number of Java method chains having a given length, for code available in a given year. The red line is a fitted regression line for 2018, based on a model fitted to the complete dataset (code and data):
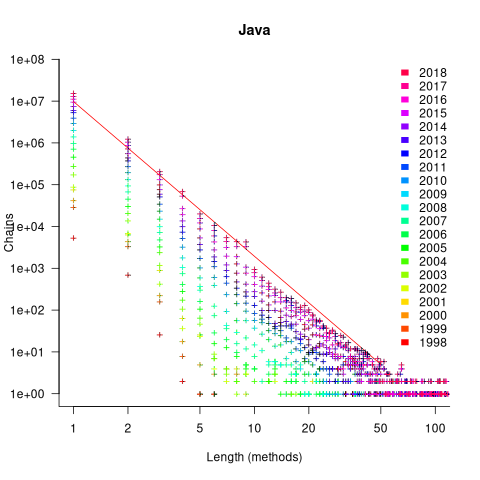
The fitted regression model is:

Why is the number of chains of all lengths growing by around 46% per year? I think this growth is driven by the growth in the amount of source measured. Measurements show that the percentage of source lines containing a method call is roughly constant. In the plot above, the number of unchained methods (i.e., chains of length one) increases in-step with the growth of chained methods. All chain lengths will grow at the same rate, if the source that contains them is growing.
What is responsible for the step change in the number of chains at around 10 methods? Nakamaru classified a random sample of 280 chains, and found that roughly 80% of chains longer than eight methods built an object, e.g., the following chain:
MoreObjects.toStringHelper(this) .add("iLine" , iLine) .add("lastK" , lastK) .add("spacesPending", spacesPending) .add("newlinesPending", newlinesPending) .add("blankLines", blankLines) .add("super", super.toString()) .toString() |
Are these chain usage patterns present in Python? The plot below shows the number of Python method chains having a given length, for code available in a given year. The red line is a fitted regression line for 2020, based on a model fitted to the complete dataset (code and data):

The fitted regression model is:

While this model is almost identical to the model fitted to the Java data (the annual growth rate is 39%), the above plot shows a large step change after chains of length two. Keshk’s paper focuses on replicating Nakamaru’s Java results, and then briefly discusses Python. I have an assortment of explanations, but nothing stands out.
Within code, how are method calls split between single calls and a chain of two or more calls?
The fractions in the plot below are calculated as the ratio of chains of length one (i.e., single method call) against chains containing two or more methods. The “j” shows Java ratios, and “p” Python ratios. The red lines show the fraction based on the total number of method calls, and the blue/green lines are based on occurrences of chains, i.e., chain of one vs chain of many (code and data):

The ratio of Java chains containing two or more methods vs one method, grew by around 6% a year between 2006 and 2018, which is only a small part of the overall 46% annual Java growth.
Method chaining is three times more common in Java than Python. In 2020 around a quarter of all method calls were in a chain of two or more, and single method calls were around ten times more common than multi-call chains.
In Python, the use of method chains has roughly remained unchanged over 15 years, with around 5% of all method calls appearing in a chain.
I don’t have a good idea for why method chains are three times more common in Java than Python. Are nested calls the more common usage in Python, or do developers use a sequence of calls communicating using temporary variables?
What of languages that don’t support method chaining, e.g., C. Is the distribution of the number of nested calls (or sequence of calls using temporaries) a power law with an exponent close to 3.7?
Suggestions and pointers to more data welcome.
Procedure nesting a once common idiom
Structured programming was a popular program design methodology that many developers/managers claimed to be using in the 1970s and 1980s. Like all popular methodologies, everybody had/has their own idea about what it involves, and as always, consultancies sprang up to promote their take on things. The 1972 book Structured programming provides a taste of the times.
The idea underpinning structured programming is that it’s possible to map real world problems to some hierarchical structure, such as in the image below. This hierarchy model also provided a comforting metaphor for those seeking to understand software and its development.

The disadvantages of the Structured programming approach (i.e., real world problems often have important connections that cannot be implemented using a hierarchy) become very apparent as programs get larger. However, in the 1970s the installed memory capacity of most computers was measured in kilobytes, and a program containing 25K lines of code was considered large (because it was enough to consume a large percentage of the memory available). A major program usually involved running multiple, smaller, programs in sequence, each reading the output from the previous program. It was not until the mid-1980s…
At the coding level, doing structured programming involves laying out source code to give it a visible structure. Code blocks are indented to show if/for/while nesting and where possible procedure/functions are nested within the calling procedures (before C became widespread, functions that did not return a value were called procedures; Fortran has always called them subroutines).
Extensive nesting of procedures/functions was once very common, at least in languages that supported it, e.g., Algol 60 and Pascal, but not Fortran or Cobol. The spread of C, and then C++ and later Java, which did not support nesting (supported by gcc as an extension, nested classes are available in C++/Java, and later via lambda functions), erased nesting from coding consideration. I started life coding mostly in Fortran, moved to Pascal and made extensive use of nesting, then had to use C and not being able to nest functions took some getting used to. Even when using languages that support nesting (e.g., Python), I have not reestablished by previous habit of using nesting.
A common rationale for not supporting nested functions/methods is that it complicate the language specification and its implementation. A rather self-centered language designer point of view.
The following Pascal example illustrates a benefit of being able to nest procedures/functions:
procedure p1; var db :array[db_size] of char; procedure p2(offset :integer); function p3 :integer; begin (* ... *) return db[offset]; end; begin var off_val :char; off_val=p3; (* ... *) end; begin (* ... *) p2(3) end; |
The benefit of using nesting is in not forcing the developer to have to either define db at global scope, or pass it as an argument along the call chain. Nesting procedures is also a method of information hiding, a topic that took off in the 1970s.
To what extent did Algol/Pascal developers use nested procedures? A 1979 report by G. Benyon-Tinker and M. M. Lehman contains the only data I am aware of. The authors analysed the evolution of procedure usage within a banking application, from 1973 to 1978. The Algol 60 source grew from 35,845 to 63,843 LOC (657 procedures to 967 procedures). A large application for the time, but a small dataset by today’s standards.
The plot below shows the number of procedures/functions having a particular lexical nesting level, with nesting level 1 is the outermost level (i.e., globally visible procedures), and distinct colors denoting successive releases (code+data):
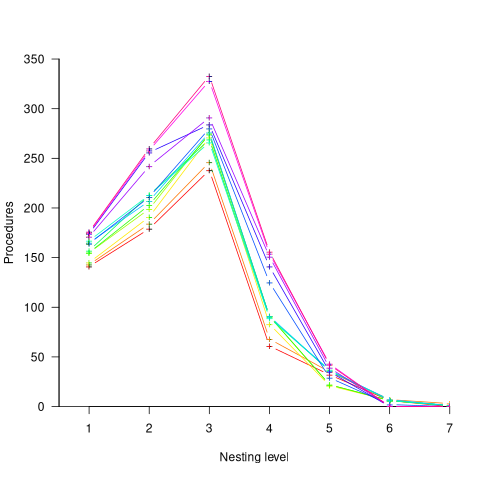
Just over 78% of procedures are nested within at least one other procedure. It’s tempting to think that nesting has a Poisson distribution, however, the distribution peaks at three rather than two. Perhaps it’s possible to fit an over-dispersed, but this feels like creating a just-so story.
What is the distribution of nested functions/methods in more recently written source? A study of 35 Python projects found 6.5% of functions nested and over twice as many (14.2%) of classed nested.
Are there worthwhile benefits to using nested functions/methods where possible, or is this once common usage mostly fashion driven with occasional benefits?
Like most questions involving cost/benefit analysis of language usage, it’s probably not sufficiently interesting for somebody to invest the effort required to run a reliable study.
Growth in number of packages for widely used languages
These days a language’s ecosystem of add-ons, such as packages, is often more important than the features provided by the language (which usually only vary in their syntactic sugar, and built-in support for some subset of commonly occurring features).
Use of a particular language grows and shrinks, sometimes over very many decades. Estimating the number of users of a language is difficult, but a possible proxy is ecosystem activity in the form of package growth/decline. However, it will take many several decades for the data needed to test how effective this proxy might be.
Where are we today?
The Module Counts website is the home for a project that counts the number of libraries/packages/modules contained in 26 language specific repositories. Daily data, in some cases going back to 2010, is available as a csv 🙂 The following are the most interesting items I discovered during a fishing expedition.
The csv file contains totals, and some values are missing (which means specifying an ‘ignore missing values’ argument to some functions). Some repos have been experiencing large average daily growth (e.g., 65 for PyPI, and 112 for Maven Central-Java), while others are more subdued (e.g., 0.7 for PERL and 3.9 for R’s CRAN). Apart from a few days, the daily change is positive.
Is the difference in the order of magnitude growth due to number of active users, number of packages that currently exist, a wide/narrow application domain (Python is wide, while R’s is narrow), the ease of getting a package accepted, or something else?
The plots below show how PyPI has been experiencing exponential growth of a kind (the regression model fitted to the daily total has the form  , where
 is the number of days since 2010-01-01; the red line is the daily diff of this equation), while Ruby has been experiencing a linear decline since late 2014 (all code+data):
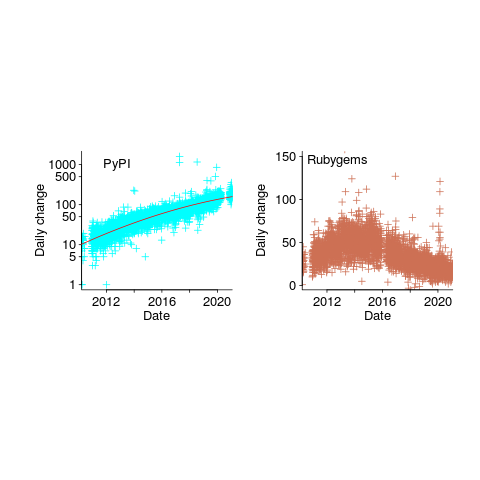
Will the five-year decline in new submissions to Rubygems continue, and does this point to an eventual demise of Ruby (a few decades from now)? Rubygems has years to go before it reaches PERL’s low growth rate (I think PERL is in terminal decline).
Are there any short term patterns, say at the weekly level? Autocorrelation is a technique for estimating the extent to which today’s value is affected by values from the immediate past (usually one or two measurement periods back, i.e., yesterday or the day before that). The two plots below show the autocorrelation for daily changes, with lag in days:
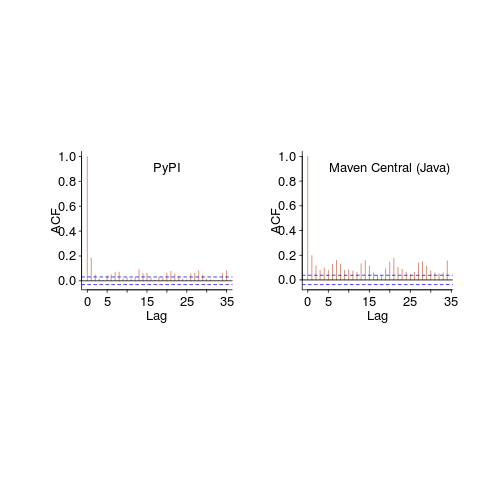
The recurring 7-day ‘peaks’ show the impact of weekends (I assume). Is the larger ”weekend-effect’ for Java, compared to PyPI, due to Java usage including a greater percentage of commercial developers (who tend not to work at the weekend)?
I did not manage to find any seasonal effect, e.g., more submissions during the winter than the summer. But I only checked a few of the languages, and only for a single peak (see code for details).
Another way of tracking package evolution is version numbering. For instance, how often do version numbers change, and which component, e.g., major/minor. There have been a couple of studies looking at particular repos over a few years, but nobody is yet recording broad coverage daily, over the long term 😉
Exercises in Programming Style: the python way
Exercises in Programming Style by Cristina Lopes is an interesting little book.
The books I have previously read on programming style pick a language, and then write various programs in that language using different styles, idioms, or just following quirky rules, e.g., no explicit loops, must use sets, etc. “Algorithms in Snobol 4” by James F. Gimpel is a fascinating read, but something of an acquired taste.
EPS does pick a language, Python, but the bulk of the book is really a series of example programs illustrating a language feature/concept that is central to a particular kind of language, e.g., continuation-passing style, publish-subscribe architecture, and reflection. All the programs implement the same problem: counting the number of occurrences of each word in a text file (Jane Austin’s Pride and Prejudice is used).
The 33 chapters are each about six or seven pages long, and contain a page or two or code. Everything is very succinct, and does a good job of illustrating one main idea.
While the first example does not ring true, things quickly pick up and there are lots of interesting insights to be had. The first example is based on limited storage (1,024 bytes), and just does not make efficient use of the available bits (e.g., upper case letters can be represented using 5-bits, leaving three unused bits or 37% of available storage; a developer limited to 1K would not waste such a large amount of storage).
Solving the same problem in each example removes the overhead of having to learn what is essentially housekeeping material. It also makes it easy to compare the solutions created using different ideas. The downside is that there is not always a good fit between the idea being illustrated and the problem being solved.
There is one major omission. Unstructured programming; back in the day it was just called programming, but then structured programming came along, and want went before was called unstructured. Structured programming allowed a conditional statement to apply to multiple statements, an obviously simple idea once somebody tells you.
When an if-statement can only be followed by a single statement, that statement has to be a goto; an if/else is implemented as (using Fortran, I wrote lots of code like this during my first few years of programming):
IF (I .EQ. J) GOTO 100 Z=1 GOTO 200 100 Z=2 200 |
Based on the EPS code in chapter 3, Monolithic, an unstructured Python example might look like (if Python supported goto):
for line in open(sys.argv[1]): start_char = None i = 0 for c in line: if start_char != None: goto L0100 if not c.isalnum(): goto L0300 # We found the start of a word start_char = i goto L0300 L0100: if c.isalnum(): goto L0300 # We found the end of a word. Process it found = False word = line[start_char:i].lower() # Ignore stop words if word in stop_words: goto L0280 pair_index = 0 # Let's see if it already exists for pair in word_freqs: if word != pair[0]: goto L0210 pair[1] += 1 found = True goto L0220 L0210: pair_index += 1 L0220: if found: goto L0230 word_freqs.append([word, 1]) goto L0300 L0230: if len(word_freqs) <= 1: goto L0300: # We may need to reorder for n in reversed(range(pair_index)): if word_freqs[pair_index][1] <= word_freqs[n][1]: goto L0240 # swap word_freqs[n], word_freqs[pair_index] = word_freqs[pair_index], word_freqs[n] pair_index = n L0240: goto L0300 L0280: # Let's reset start_char = None L0300: i += 1 |
If you do feel a yearning for the good ol days, a goto package is available, enabling developers to write code such as:
from goto import with_goto @with_goto def range(start, stop): i = start result = [] label .begin if i == stop: goto .end result.append(i) i += 1 goto .begin label .end return result |
Student projects for 2019/2020
It’s that time of year when students are looking for an interesting idea for a project (it might be a bit late for this year’s students, but I have been mulling over these ideas for a while, and might forget them by next year). A few years ago I listed some suggestions for student projects, as far as I know none got used, so let’s try again…
Checking the correctness of the Python compilers/interpreters. Lots of work has been done checking C compilers (e.g., Csmith), but I cannot find any serious work that has done the same for Python. There are multiple Python implementations, so it would be possible to do differential testing, another possibility is to fuzz test one or more compiler/interpreter and see how many crashes occur (the likely number of remaining fault producing crashes can be estimated from this data).
Talking to the Python people at the Open Source hackathon yesterday, testing of the compiler/interpreter was something they did not spend much time thinking about (yes, they run regression tests, but that seemed to be it).
Finding faults in published papers. There are tools that scan source code for use of suspect constructs, and there are various ways in which the contents of a published paper could be checked.
Possible checks include (apart from grammar checking):
- incorrect or inaccurate numeric literals.
Checking whether the suspect formula is used is another possibility, provided the formula involved contains known constants.
- inconsistent statistics reported (e.g., “8 subjects aged between 18-25, average age 21.3″ may be correct because 21.3*8 == 170.4, ages must add to a whole number and the values 169, 170 and 171 would not produce this average), and various tools are available (e.g., GRIMMER).
Citation errors are relatively common, but hard to check automatically without a good database (I have found that a failure of a Google search to return any results is a very good indicator that the reference does not exist).
There are lots of tools available for taking pdf files apart; I use pdfgrep a lot
Number extraction. Numbers are some of the most easily checked quantities, and anybody interested in fact checking needs a quick way of extracting numeric values from a document. Sometimes numeric values appear as numeric words, and dates can appear as a mixture of words and numbers. Extracting numeric values, and their possible types (e.g., date, time, miles, kilograms, lines of code). Something way more sophisticated than pattern matching on sequences of digit characters is needed.
spaCy is my tool of choice for this sort of text processing task.
The 520’th post
This is the 520’th post on this blog, which will be 10-years old tomorrow. Regular readers may have noticed an increase in the rate of posting over the last few months; at the start of this month I needed to write 10 posts to hit my one-post a week target (which has depleted the list of things I keep meaning to write about).
What has happened in the last 10-years?
- I no longer visit libraries, which are becoming coffee shops+wifi hot-spots where people who have librarian in their job title, hot desk; books, they are around here somewhere. I used to regularly visit libraries, particularly while working on my C book. No libraries have so far needed to be visited, for the writing of my evidence-based software engineering book,
- many old manuals, reports, books and magazines became freely available for download, via sites like the Internet Archive, Bitsavers and the Defense Technical Information Center; for second hand books there is AbeBooks. Site like Research Gate, Semantic Scholar and Google Scholar are fantastic sources for more recent work; for new books there is Amazon,
- Github became the place to make source code+stuff available,
- researchers in software engineering started to become interested in evidence-based research. In the UK the CREST Open Workshops were a fantastic series of events; I went to about a third of them, and there were often a couple of gold nuggets per event (a change of funding means running future events will require a lot more work),
- smart phones became the last, next, major software consumer ecosystem (capturing a large percentage of the world’s population means there is no room left for something bigger), and the cloud started on its path to being 99% of the commercial software ecosystem,
- Python joined the short-list to become the world’s primary programming language (assuming that people still run programs outside of the browser). The decline of PERL became very obvious, and work on adding new features to Cobol stopped (work on adding features to Fortran is still going strong),
- known faults are now being automatically fixed by modifying the source code (using genetic programming). This has yet to move out of research, but we all know where it’s going,
- whole program optimization of systems containing millions of lines of code became a viable option for commercial developers (a topic of late night discussion for compiler writers in the 1980s, and perhaps earlier decades, when having more than 64K of memory was treated as nirvana),
- after 20-years of being the only major open source compiler tool-chain, gcc got some serious competition. I originally predicted that llvm would disappear, failing to recognize that Apple were supporting it for licensing reasons,
- the death throes of Moore’s law went from subtle to, isn’t it dead yet?
I probably missed several major events hiding in plain sight, either because I am too close to them or blinkered.
What did not happen in the last 10 years?
- No major new languages. These require major new hardware ecosystems; in the smartphone market Android used Java and iOS made use of existing languages. There were the usual selection of fashion/vanity driven wannabes, e.g., Julia, Rust, and Go. The R language started to get noticed, but it has been around since 1995, and Python looks set to eventually kill it off,
- no accident killing 100+ people has been attributed to faults in software. Until this happens, software engineering has a dead bodies problem,
- the creation of new software did not slow down from its break-neck speed,
- in the first few years of this blog I used to make yearly predictions, which did not happen (most of the time).
Now I can relax for 9.5 years, before scurrying to complete 1,040 posts, i.e., the rate of posting will now resume its previous, more sedate, pace.
StatsModels: the first nail in R’s coffin
In 2012, when I decided to write a book on evidence-based software engineering, R was the obvious system to use for data analysis. At the time, lots of new books had “using R” or “with R” added at the end of their titles; I chose “using R”.
When developers tell me they need to do some statistical analysis, and ask whether they should use Python or R, I tell them to use Python if statistics is a small part of the program, otherwise use R.
If I started work on the book today, I would till choose R. If I were starting five-years from now, I could be choosing Python.
To understand why I think Python will eventually take over the niche currently occupied by R, we need to understand the unique selling points of both systems.
R’s strengths are that it supports a way of thinking that is a good fit for doing data analysis and has an extensive collection of packages that simplify the task of applying a wide variety of analysis techniques to data.
Python also has packages supporting the commonly used data analysis techniques. But nearly all the Python packages provide a developer-mentality interface (i.e., they provide an API like any other package), R provides data-analysis-mentality interfaces. R supports a way of thinking that data analysts can identify with.
Python’s strengths, over R, are a much larger base of developers and language support for writing large programs (R is really a scripting language). Yes, Python has a package ecosystem supporting the full spectrum of application domains, this is not relevant for analysing a successful invasion of R’s niche market (but it is relevant for enticing new developers who are still making up their mind).
StatsModels is a Python package based around R’s data-analysis-mentality interface. When I discovered this package a few months ago, I realised the first nail had been hammered into R’s coffin.
Yes, today R has nearly all the best statistical analysis packages and a large chunk of the leading edge stuff. But packages can be reimplemented (C code can be copy-pasted, the R code mapped to Python); there is no magic involved. Leading edge has a short shelf life, and what proves to be useful can be duplicated; the market for leading edge code in a mature market (e.g., data analysis) is tiny.
A bunch of bright young academics looking to make a name for themselves will see the major trees in the R forest have been felled. The trees in the Python data-analysis-mentality forest are still standing; all it takes is a few people wanting to be known as the person who implemented the Python package that everybody uses for XYZ analysis.
A collection of packages supporting the commonly (and eventually not so commonly) used data analysis techniques, with a data-analysis-mentality interface, removes a major selling point for using R. Python is a bigger developer market with support for many other application domains.
The flow of developers starting out with R will slow down, casual R users will have nothing to lose from trying out another language when the right project comes along (another language on the CV looks good and Python is a bigger market). There will be groups where everybody uses R and will continue to use R because that is what everybody else in the group uses. Ten-Twenty years from now R, developers could be working in a ghost town.
Perl’s failure to grow and Python takes over
Perl, once the most widely used scripting language, has been in decline for many years; the decline now looks terminal (many decades from now, when its die-hard users have died), what happened?
Python is what happened. Why was this? Did Perl have a major fail, did Python acquire pixie dust that could not be replicated, or something else?
Some commentators point to the failure to produce a timely release of Perl 6; a major reworking of the language announced in 2000 with a stumbling release made available around 2015.
I think the real issue is a failure for Perl to take off outside its core use as a systems language. Perl is famous for its one-liners, but not for writing large programs (yes, it can be done, but would many developers would really want to?); a glance of the categories in its module library shows; those 174,970 modules (at the time of writing) are not widely spread over application domains (i.e., not catering to a wide audience).
Perl 5 was failing to grow outside its base before Perl 6 began its protracted failure to launch.
Language use is a winner take-all game, developers create more packages, support tools, and new users who combine to attract more developers. Continuing support for minority languages comes from die-hard users, existing software that is worth somebody paying to maintain and niche advantages.
These days, language success is founded on the associated package ecosystem (Go and Rust have minuscule package ecosystems, which is why they are living on borrowed time, other languages will eventually take away their sheen of trendiness). Developers use languages to build stuff, the days of writing the code for almost everything are long gone; interesting software is created by taking advantage of packages written by others. Python was in the right place, at the right time to acquire a wide variety of commercial grade packages.
It’s difficult to see Python being displaced as the lingua franca of software development. Its language features are almost irrelevant, its package ecosystem is everything. The winner will eventually take all.
I’m sure the cycle of languages becoming popular for a few years, before disappearing, will continue. There have always been, and will always be, fashionable languages.
Recent Comments