Converting graphs in pdf files to csv format
Looking at a graph displayed as part of a pdf document is so tantalizing; I want that data as a csv!
One way to get the data is to email the author(s) and ask for it. I do this regularly and sometimes get the apologetic reply that the data is confidential. But I can see the data! Yes, but we only got permission to distribute the paper. I understand their position and would give the same reply myself; when given access to a company’s confidential data, explicit permission is often given about what can and cannot be made public with lists of numbers being on the cannot list.
The Portable Document Format was designed to be device independent, which means it contains a description of what to display rather than a bit-map of pixels (ok, it can contain a bit-map of pixels (e.g., a photograph) but this rather defeats the purpose of using pdf). It ought to be possible to automatically extract the data points from a graph and doing this has been on my list of things to do for a while.
I was mooching around the internals of a pdf last night when I spotted the line: /Producer (R 2.8.1); the authors had used R to generate the graphs and I could look at the R source code to figure out what was going on :-). I suspected that each line of the form: /F1 1 Tf 1 Tr 6.21 0 0 6.21 135.35 423.79 Tm (l) Tj 0 Tr was a description of a circle on the page and the function PDF_Circle in the file src/library/grDevices/src/devPS.c told me what the numbers meant; I was in business!
I also managed to match up other lines in the pdf file to the output produced by the functions PDF_Line and PDFSimpleText; it looked like the circles were followed by the axis tick marks and the label on each tick mark. Could things get any easier?
In suck-it-and-see projects like this it is best to use very familiar tools, this allows cognition to be focused on the task at hand. For me this meant using awk to match lines in pdf files and print out the required information.
Running the pdf through an awk script produced what looked like sensible x/y coordinates for circles on the page, the stop/start end-points of lines and text labels with their x/y coordinates. Now I needed to map the page x/y coordinates to within graph coordinate points.
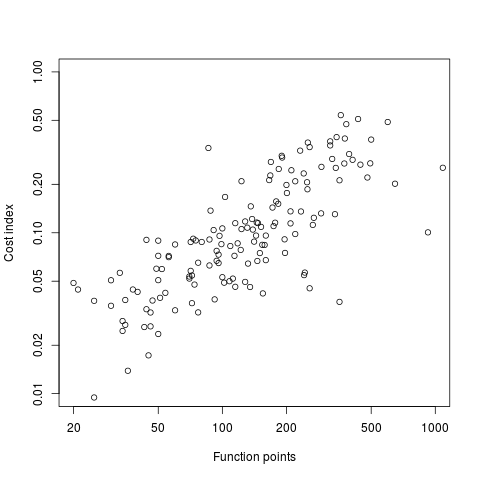
After the circle coordinates in the output from the script were a series of descriptions of very short lines which looked like axis tick marks to me, especially since they were followed by coordinates of numbers that matched what appeared in the pdf graphs. This information is all that is needed to map from page coordinates to within graph coordinates. The graph I was interested in (figure 6) used logarithmic axis, so things were made a bit complicated by the need to perform a log transform.
Running the output (after some cut and pasting to removed stuff associated with other graphs in the pdf) from the first script through another awk script produced a csv file that could be fed into R’s plot to produce a graph that looked just like the original!
I would say it is possible to extract the data points from any graph, generated using R producing pdf or ps, contained within a pdf file.
The current scripts are very specific to the figure I was interested in, this is more to do with my rough and ready approach to solving the problem which makes assumptions about that is in the data; a more sophisticated version could handle common variations on the theme and with a bit of elbow grease point-and-click might be made to work.
It is probably also possible to extract data points in graphs produced by other tools, ‘all’ that is needed is information on the encoding used.
Extracting data from graphs generated to an image format such as png or jpg are going to need image processing software such as that used to extract data from images of tables.
You should also be aware of WebPlotDigitizer, http://arohatgi.info/WebPlotDigitizer/
@William Idsardi
Thanks, I have used WebPlotDigitizer in the past for graphical plots, it is very good. Adding image recognition to it, to provide a first pass at locating points, has been on my list of things to do forever.
There is also Plot Digitizer whichI have not tried in anger. For R there is digitize.
For R, the grImport package can also be used for this sort of thing (see Section 4.1 of http://www.jstatsoft.org/v30/i04/paper)
You can use im2graph, a digitizing software, to convert graph to numbers (i.e., data).
im2graph is free and available for Linux and Windows.
See http://www.im2graph.co.il