Archive
Pomodoros worked during a day: an analysis of Alex’s data
Regular readers know that I am always on the lookout for software engineering data. One search technique is to feed a ‘magic’ phrase into a search engine, this can locate data hiding in plain sight. This week the magic phrase: “record of pomodoros” returned pages discussing two collections of daily Pomodoros worked, each over a year, plus several possible collections, i.e., not explicitly stated. My email requests for data have so far returned one of the collections, kindly made available by Alex Altair, and this post discusses Alex’s data (I have not discussed the data with Alex, who I’m hoping won’t laugh too loud at the conclusions I have reached).
Before analyzing data I always make predictions about what I expect to see. I know from the email containing the data that it consisted of two columns: date and Pomodoro’s worked, i.e., no record of task names. The first two predictions for this data were the two most common patterns seen in estimation data, i.e., use of round numbers, and a weekend-effect (most people don’t work during the weekend and the autocorrelation of the daily counts contain peaks at lags of 6 and 7). The third prediction was that over time the daily total Pomodoro counts would refine into counts for each of the daily tasks (I had looked at the first few lines of the data and seen totals for the daily Pomodoros worked.
The Renzo Pomodoro dataset is my only previous experience analysing Pomodoro data. Renzo created a list of tasks for the day, estimated the number of Pomodoros for each task would take, and recorded how many it actually took. For comparison, the SiP effort estimation dataset estimates software engineering tasks in hours.
Alex uses Pomodoros as a means of focusing his attention on the work to be done, and the recorded data is a measure of daily Pomodoro work done.
I quickly discovered that all my predictions were wrong, i.e., no obvious peaks showing use of round numbers, no weekend effect, and always daily totals. Ho-hum.
The round number effect is very prominent in estimates, but is not always visible in actuals; unless people are aiming to meet targets or following Parkinson’s law.
How many days had one Pomodoro worked, how many two Pomodoro, etc? The plot below shows the number of days for which a given number of Pomodoros were worked (the number of days with zero Pomodoros is not shown); note the axis are log scaled. The blue points are for all days in 2020, and the green points are all days in 2020+178 days of 2021. The red lines are two sets of two fitted power laws (code+data):
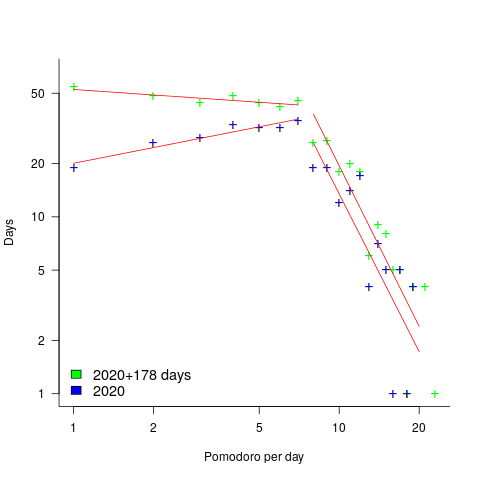
Why the sudden change of behavior after seven Pomodoro? Given a Pomodoro of 25-minutes (Alex says he often used this), seven of them is just under 3-hours, say half a day. Perhaps Alex works half a day, for every day of the week.
Why the change of behavior since the end of 2020 (i.e., exponent of left line changes from 0.3 to -0.1, exponent of right line is -3.0 in both cases)? Perhaps Alex is trying out another technique. The initial upward trend is consistent with the Renzo Pomodoro dataset.
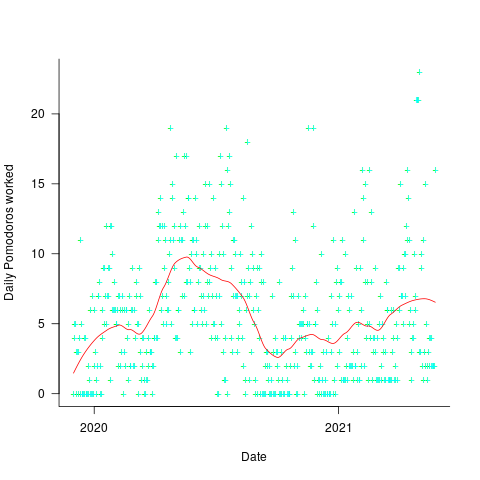
The daily average Pomodoros worked is unchanged at around 5.6. The following plot shows daily Pomodoros worked over the 543 days, red line is a fitted loess model.
The weekend effect might not be present, but there is a strong correlation between adjacent days (code+data). The best fitting ARIMA model gives the equation:  , where:
  is the Pomodoros worked on day
  ,
,  Pomodoros worked on the previous day,
  is white noise (e.g., a Normal distribution) with a zero mean and a standard deviation of 4 (in this case) on day , and
  the previous day’s noise (see section 11.10 of my book for technical time series details).
This model is saying that the number of Pomodoros worked today is strongly influenced by yesterday’s Pomodoro worked, modulated by a large random component that could be large enough to wipe out the previous days influence. Is this likely to be news to Alex, or to anybody looking at the plot of Pomodoros over time? Probably not.
For me, the purpose of data analysis is to find patterns of behavior that are of use to those involved in the processes that generated the data (for many academics, at least in software engineering, the purpose appears to be to find patterns that can be used to publish papers, and given enough searching, it is always possible to find patterns in data). What patterns of behavior might Alex be interested in?
Does more Pomodoro work get done at the start of the week, compared to the end of the week? The following heatmap is based on the number of week days on which a given number of Pomodoros were worked. The redder the region, the more likely that value is likely to occur (code+data):
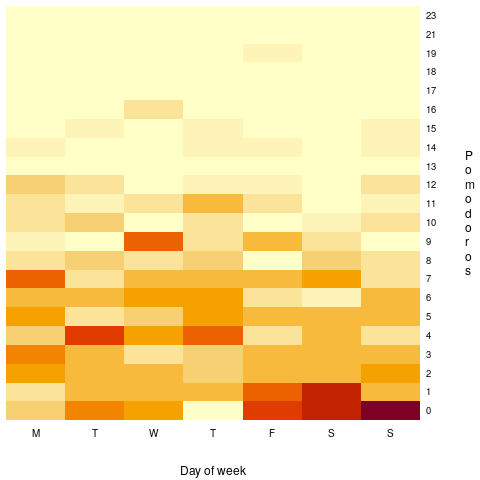
There are certainly more days near the end of the week having little or no Pomodoro work, and the high Pomodoro work days appear to be nearer the start of the week. I need to find a statistical technique that quantifies these observations.
I think that the middle plot is the most generally useful, it illustrates how variable the work done during a day can be.
Is Alex’s Pomodoro work typical or unusual? We will have to wait for a lot more data before that question can be addressed.
If you are a Pomodoro user, and have ideas for possible patterns in the data, please let me know.
As always, pointers to more data, Pomodoro or otherwise, most welcome.
Where are the industrial strength R compilers?
Why don’t compiler projects for the R language make it into production use? The few that have been written have remained individual experimental products, e.g., RLLVMCompile.
Most popular languages attract many compiler implementations. I’m not saying that any of these implementations have more than a handful of users, that they implement the full language (a full implementation is not common), or that they fulfil any need other than their implementers desire to build something.
A commonly heard reason for the lack of production R compilers is that it is not worth the time and effort, because most of an R program’s time is spent in the library code which is written in a compiled language (e.g., C or Fortran). The fact that it is probably not worth the time and effort has not stopped people writing compilers for other languages, but then I think that the kind of people who use R tend not to be the kind of people who want to spend their time writing compilers. On the whole, they are the kind of people who are into statistics and data analysis.
Is it true that that most R programs spend most of their time executing library code? It’s certainly true for me. But I have noticed that a lot of the library functions executed by my code are written in R. Also, if somebody uses R for all their programming needs (it might be the only language they know), then their code might not be heavily library dependent.
I was surprised to read about Tierney’s byte code compiler, because his implementation is how I thought the R-core’s existing implementation worked (it does now). The internals of R is based on 1980s textbook functional techniques, and like many book implementations of the day, performance is dependent on the escape hatch of compiled code. R’s implementers wisely spent their time addressing user concerns, which revolved around statistics and visual presentation, i.e., not internal implementation technicalities.
Building an R compiler is easy, the much harder and time-consuming part is the runtime system.
Threaded code is a quick and simple approach to compiler implementation. R source gets mapped to a sequence of C function calls, with these functions proving a wrapper to library functions implementing the appropriate basic functionality, e.g., add two vectors. This approach has been the subject of at least one Master’s thesis. Thesis implementations rarely reach production use because those involved significantly underestimate the work that remains to be done, which is usually a lot more than the original implementation.
A simple threaded code approach provides a base for subsequent optimization, with the base having a similar performance to an interpreter. Optimizing requires figuring out details of the operations performed and replacing generic function calls with ones designed to be fast for specific cases, or even better replacing calls with inline code, e.g., adding short vectors of integers. There is a lot of existing work for scripting languages and a few PhD thesis researching R (e.g., Wang). The key technique is static analysis of R source.
Jan Vitek is running what appears to be the most active R compiler research group, at the moment e.g., the Ř project. Research can be good for uncovering language usage and trying out different techniques, but it is not intended to produce industry strength code. Lots of the fancy optimizations in early versions of the gcc C compiler started life as a PhD thesis, with the respective individual sometimes going on to spend a few years creating a production quality version for the released compiler.
The essential ingredient for building a production compiler is persistence. There are an awful lot of details that need to be sorted out (this is why research project code does not directly translate to production code, they ignore ‘minor’ details in order to concentrate on the ‘interesting’ research problem). Is there a small group of people currently beavering away on a production quality compiler for R? If there is, I can understand being discrete, on long-term projects it can be very annoying to have people regularly asking when the software is going to be released.
To have a life, once released, a production compiler needs to attract users, who are often loyal to their current compiler (because they know that their code works for this compiler); there needs to be a substantial benefit to entice people to switch. The benefit of compiling R to machine code, rather than interpreting, is performance. What performance improvement is needed to attract a viable community of users (there is always a tiny subset of users who will pay lots for even small performance improvements)?
My R code is rarely cpu bound, so I am not in the target audience, no matter what the speed-up. I don’t have any insight in the performance problems experienced by the R community, and have no idea whether a factor of two, five, ten or more would be enough.
Delphi and group estimation
A software estimate is a prediction about the future. Software developers were not the first people to formalize processes for making predictions about the future. Starting in the last 1940s, the RAND Corporation’s Delphi project created what became known as the Delphi method, e.g., An Experiment in Estimation, and Construction of Group Preference Relations by Iteration.
In its original form experts were anonymous; there was a “… deliberate attempt to avoid the disadvantages associated with more conventional uses of experts, such as round-table discussions or other milder forms of confrontation with opposing views.”, and no rules were given for the number of iterations. The questions involved issues whose answers involved long term planning, e.g., how many nuclear weapons did the Soviet Union possess (this study asked five questions, which required five estimates). Experts could provide multiple answers, and had to give a probability for each being true.
One of those involved in the Delphi project (Helmer-Hirschberg) co-founded the Institute for the Future, which published reports about the future based on answers obtained using the Delphi method, e.g., a 1970 prediction of the state-of-the-art of computer development by the year 2000 (Dalkey, a productive member of the project, stayed at RAND).
The first application of Delphi to software estimation was by Farquhar in 1970 (no pdf available), and Boehm is said to have modified the Delphi process to have the ‘experts’ meet together, rather than be anonymous, (I don’t have a copy of Farquhar, and my copy of Boehm’s book is in a box I cannot easily get to); this meeting together form of Delphi is known as Wideband Delphi.
Planning poker is a variant of Wideband Delphi.
An assessment of Delphi by Sackman (of Grant-Sackman fame) found that: “Much of the popularity and acceptance of Delphi rests on the claim of the superiority of group over individual opinions, and the preferability of private opinion over face-to-face confrontation.” The Oracle at Delphi was one person, have we learned something new since that time?
Group dynamics is covered in section 3.4 of my Evidence-based software engineering book; resource estimation is covered in section 5.3.
The likelihood that a group will outperform an individual has been found to depend on the kind of problem. Is software estimation the kind of problem where a group is likely to outperform an individual? Obviously it will depend on the expertise of those in the group, relative to what is being estimated.
What does the evidence have to say about the accuracy of the Delphi method and its spinoffs?
When asked to come up with a list of issues associated with solving a problem, groups generate longer lists of issues than individuals. The average number of issues per person is smaller, but efficient use of people is not the topic here. Having a more complete list of issues ought to be good for accurate estimating (the validity of the issues is dependent on the expertise of those involved).
There are patterns of consistent variability in the estimates made by individuals; some people tend to consistently over-estimate, while others consistently under-estimate. A group will probably contain a mixture of people who tend to over/under estimate, and an iterative estimation process that leads to convergence is likely to produce a middling result.
By how much do some people under/over estimate?
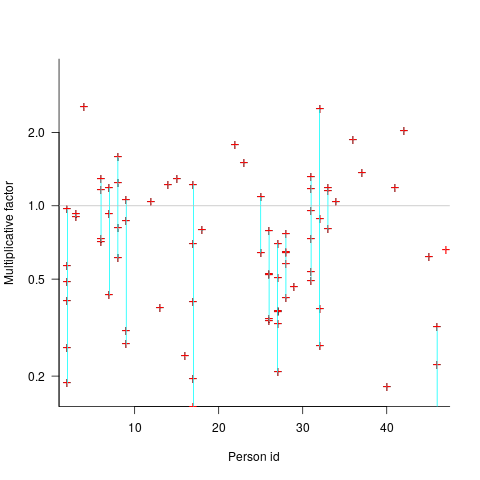
The multiplicative factor values (y-axis) appearing in the plot below are from a regression model fitted to estimate/actual implementation time for a project involving 13,669 tasks and 47 developers (data from a study Nichols, McHale, Sweeney, Snavely and Volkmann). Each vertical line, or single red plus, is one person (at least four estimates needed to be made for a red plus to occur); the red pluses are the regression model’s multiplicative factor for that person’s estimates of a particular kind of creation task, e.g., design, coding, or testing. Points below the grey line are overestimation, and above the grey line the underestimation (code+data):
What is the probability of a Delphi estimate being more accurate than an individual’s estimate?
If we assume that a middling answer is more likely to be correct, then we need to calculate the probability that the mix of people in a Delphi group produces a middling estimate while the individual produces a more extreme estimate.
I don’t have any Wideband Delphi estimation data (or rather, I only have tiny amounts); pointers to such data are most welcome.
Estimate variability for the same task
If 100 people estimate the time needed to implement a feature, in software, what is the expected variability in the estimates?
Studies of multiple implementations of the same specification suggest that standard deviation of the mean number of lines across implementations is 25% of the mean (based on data from 10 sets of multiple implementations, of various sizes).
The plot below shows lines of code against the number of programs (implementing the 3n+1 problem) containing that many lines (red line is a Normal distribution fitted by eye, code and data):
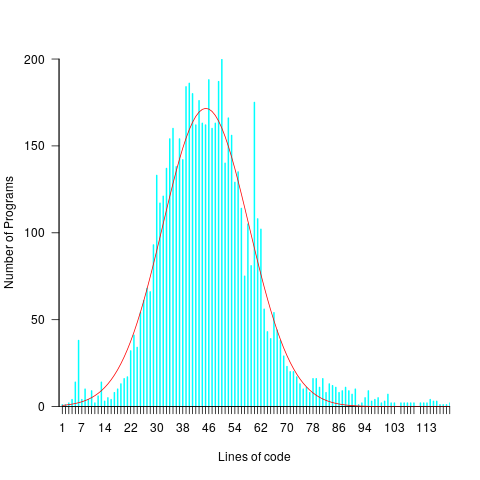
Might any variability in the estimates for task implementation be the result of individuals estimating their own performance (which is variable)?
To the extent that an estimate is based on a person’s implementation experience, a developer’s past performance will have some impact on their estimate. However, studies have found a great deal of variability between individual estimates and their corresponding performance.
One study asked 14 companies to bid on implementing a system (four were eventually chosen to implement it; see figure 5.2 in my book). The estimated elapsed time varied by a factor of ten. Until the last week this was the only study of this question for which the data was available (and may have been the only such study).
A study by Alhamed and Storer investigated crowd-sourcing of effort estimates, structured by use of planning poker. The crowd were workers on Amazon’s Mechanical Turk, and the tasks estimated came from the issue trackers of JBoss, Apache and Spring Integration (using issues that had been annotated with an estimate and actual time, along with what was considered sufficient detail to make an estimate). An initial set of 419 issues were whittled down to 30, which were made available, one at a time, as a Mechanical Turk task (i.e., only one issue was available to be estimated at any time).
Worker estimates were given using a time-based category (i.e., the values 1, 4, 8, 20, 40, 80), with each value representing a unit of actual time (i.e., one hour, half-day, day, half-week, week and two weeks, respectively).
Analysis of the results from a pilot study were used to build a model that detected estimates considered to be low quality, e.g., providing a poor justification for the estimate. These were excluded from any subsequent iterations.
Of the 506 estimates made, 321 passed the quality check.
Planning poker is an iterative process, with those making estimates in later rounds seeing estimates made in earlier rounds. So estimates made in later rounds are expected to have some correlation with earlier estimates.
Of the 321 quality check passing estimates, 153 were made in the first-round. Most of the 30 issues have 5 first-round estimates each, one has 4 and two have 6.
Workers have to pick one of five possible value as their estimate, with these values being roughly linear on a logarithmic scale, i.e., it is not possible to select an estimate from many possible large values, small values, or intermediate values. Unless most workers pick the same value, the standard deviation is likely to be large. Taking the logarithm of the estimate maps it to a linear scale, and the plot below shows the mean and standard deviation of the log of the estimates for each issue made during the first-round (code+data):
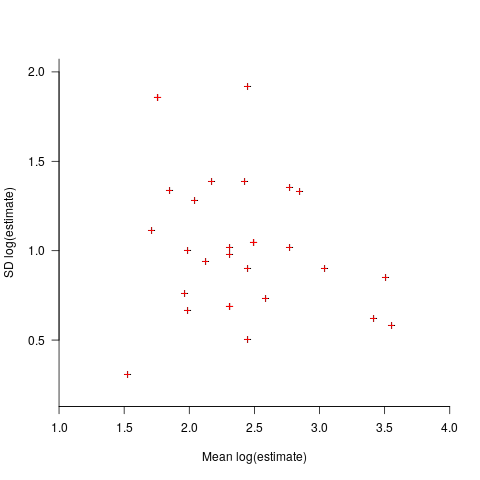
The wide spread in the standard deviations across a spread of mean values may be due to small sample size, or it may be real. The only way to find out is to rerun with larger sample sizes per issue.
Now it has been done once, this study needs to be run lots of times to measure the factors involved in the variability of developer estimates. What would be the impact of asking workers to make hourly estimates (they would not be anchored by experimenter specified values), or shifting the numeric values used for the categories (which probably have an anchoring effect)? Asking for an estimate to fix an issue in a large software system introduces the unknown of all kinds of dependencies, would estimates provided by workers who are already familiar with a project be consistently shifted up/down (compared to estimates made by those not familiar with the project)? The problem of unknown dependencies could be reduced by giving workers self-contained problems to estimate, e.g., the 3n+1 problem.
The crowdsourcing idea is interesting, but I don’t think it will scale, and I don’t see many companies making task specifications publicly available.
To mimic actual usage, research on planning poker (which appears to have non-trivial usage) needs to ensure that the people making the estimates are involved during all iterations. What is needed is a dataset of lots of planning poker estimates. Please let me know if you know of one.
Claiming that software is AI based is about to become expensive
The European Commission is updating the EU Machinery Directive, which covers the sale of machinery products within the EU. The updates include wording to deal with intelligent robots, and what the commission calls AI software (contained in machinery products).
The purpose of the initiative is to: “… (i) ensuring a high level of safety and protection for users of machinery and other people exposed to it; and (ii) establishing a high level of trust in digital innovative technologies for consumers and users, …”
What is AI software, and how is it different from non-AI software?
Answering these questions requires knowing what is, and is not, AI. The EU defines Artificial Intelligence as:
- ‘AI system’ means a system that is either software-based or embedded in hardware devices, and that displays behaviour simulating intelligence by, inter alia, collecting and processing data, analysing and interpreting its environment, and by taking action, with some degree of autonomy, to achieve specific goals;
- ‘autonomous’ means an AI system that operates by interpreting certain input, and by using a set of predetermined instructions, without being limited to such instructions, despite the system’s behaviour being constrained by and targeted at fulfilling the goal it was given and other relevant design choices made by its developer;
‘Simulating intelligence’ sounds reasonable, but actually just moves the problem on, to defining what is, or is not, intelligence. If intelligence is judged on an activity by activity bases, will self-driving cars be required to have the avoidance skills of a fly, while other activities might have to be on par with those of birds? There is a commission working document that defines: “Autonomous AI, or artificial super intelligence (ASI), is where AI surpasses human intelligence across all fields.”
The ‘autonomous’ component of the definition is so broad that it covers a wide range of programs that are not currently considered to be AI based.
The impact of the proposed update is that machinery products containing AI software are going to incur expensive conformance costs, which products containing non-AI software won’t have to pay.
Today it does not cost companies to claim that their systems are AI based. This will obviously change when a significant cost is involved. There is a parallel here with companies that used to claim that their beauty products provided medical benefits; the Federal Food and Drug Administration started requiring companies making such claims to submit their products to the new drug approval process (which is hideously expensive), companies switched to claiming their products provided “… the appearance of …”.
How are vendors likely to respond to the much higher costs involved in selling products that are considered to contain ‘AI software’?
Those involved in the development of products labelled as ‘safety critical’ try to prevent costs escalating by minimizing the amount of software treated as ‘safety critical’. Some of the arguments made for why some software is/is not considered safety critical can appear contrived (at least to me). It will be entertaining watching vendors, who once shouted “our products are AI based”, switching to arguing that only a tiny proportion of the code is actually AI based.
A mega-corp interested in having their ‘AI software’ adopted as an industry standard could fund the work necessary for the library/tool to be compliant with the EU directives. The cost of initial compliance might be within reach of smaller companies, but the cost of maintaining compliance as the product evolves is something that only a large company is likely to be able to afford.
The EU’s updating of its machinery directive is the first step towards formalising a legal definition of intelligence. Many years from now there will be a legal case that creates what later generation will consider to be the first legally accepted definition.
Recent Comments