Archive
Computer: Plot the data
Last Saturday I attended my first 24-hour hackathon in over 5-years (as far as I know, also the first 24-hour hackathon in London since COVID); the GenAI Hackathon.
I had a great idea for the tool to build. Readers will be familiar with the scene in sci-fi films where somebody says “Computer: Plot the data”, and a plot appears on the appropriate screen. I planned to implement this plot-the-data app using LLMs.
The easy option is to use speech to text, using something like OpenAI’s Whisper, as a front-end to a conventional plotting program. The hard option is to also use an LLM to generate the code needed to create the plot; I planned to do it the hard way.
My plan was to structure the internal functionality using langchain tools and agents. langchain can generate Python and execute this code.
I decided to get the plotting working first, and then add support for speech input. With six lines of Python I created a program that works every now and again; here is the code (which assumes that the environment variable OPENAI_API_KEY has been set to a valid OpenAI API key; the function create_csv_agent is provided by langchain):
from langchain.agents import create_csv_agent from langchain.llms import OpenAI import pandas agent = create_csv_agent(OpenAI(temperature=0.0, verbose=True), "aug-oct_day_items.csv", verbose=True) agent.run("Plot the Aug column against Oct column.") |
Sometimes this program figures out that it needs to call matplotlib to display the data, sometimes its output is a set of instructions for how this plot functionality could be implemented, sometimes multiple plots appear (with lines connecting points, and/or a scatter plot).
Like me, and others, readers who have scratched the surface of LLMs have read that setting the argument temperature=0.0 ensures that the output is always the same. In theory this is true, but in practice the implementation of LLMs contains some intrinsic non-determinism.
The behavior can be made more consistent by giving explicit instructions (just like dealing with humans). I prefixed the user input instructions to use matplotlib, use column names as the axis labels, and to generate a scatter plot, finally a request to display the plot is appended.
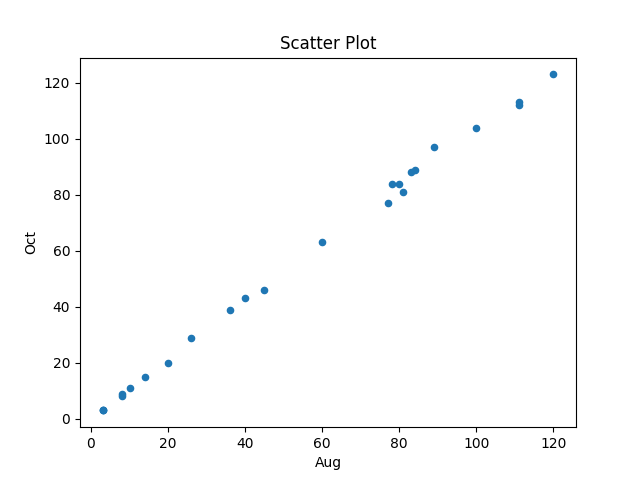
In the following code, the first call to plot_data specifies the ‘two month columns’, and the appropriate columns are selected from the csv file.
from langchain.agents import create_csv_agent from langchain.llms import OpenAI import pandas def plot_data(file_str, usr_str): agent = create_csv_agent(OpenAI(temperature=0.0, model_name="text-davinci-003", verbose=True), file_str, verbose=True) plot_txt="Use matplotlib to plot data and" +\ " use the column names for axis labels." +\ " I want you to create a scatter " +\ usr_str + " Display the plot." agent.run(plot_txt) plot_data("aug-oct_day_items.csv", "plot using the two month columns.") plot_data("task-est-act.csv", "plot using the estimates and actuals.") plot_data("task-est-act.csv", "plot the estimates and actuals using a logarithmic scale.") |
The first call to plot_data worked as expected, producing the following plot (code+data):
The second call failed with an ‘internal’ error. The generated Python has incorrect indentation:
IndentationError: unexpected indent (<unknown>, line 2) I need to make sure I have the correct indentation. |
While the langchain agent states what it needs to do to correct the error, it repeats the same mistake several times before giving up.
Like a well-trained developer, I set about trying different options (e.g., changing the language model) and searching various question/answer sites. No luck.
Finally, I broke with software developer behavior and added the line “Use the same indentation for each python statement.” to the prompt. Prompt engineering behavior is to explicitly tell the LLM what to do, not to fiddle with configuration options.
So now the second call to plot_data works, and the third call sometimes does odd things.
At the hack I failed to convince anybody else to work on this project with me. So I joined another project and helped out (they were very competent and did not really need my help), while fiddling with the Plot-the-data idea.
The code+test data is in the Plot-the-data Github repo. Pull requests welcome.
Is the code reuse problem now solved?
Writing a program to solve a problem involves breaking the problem down into subcomponents that have a known coding solution, and connecting the input/output of these subcomponents into sequences that produced the desired behavior.
When computers first became available, developers had to write every subcomponent. It was soon noticed that new programs contained some functionality that was identical to functionality present in previously written programs, and software libraries were created to reduce development cost/time through reuse of existing code. Developers have being sharing code since the very start of computing.
To be commercially viable, computer manufacturers discovered that they not only had to provide vendor specific libraries, they also had to support general purpose functionality, e.g., sorting and maths libraries.
The Internet significantly reduced the cost of finding and distributing software, enabling an explosion in the quality and quantity of publicly available source code. It became possible to write major subcomponents by gluing together third-party libraries and packages (subject to licensing issues).
Diversity of the ecosystems in which libraries/packages have to function means that developers working in different environments have to apply different glue. Computing diversity increases costs.
A lot of effort was invested in trying to increase software reuse in a very diverse world.
In the 1990 there was a dramatic reduction in diversity, caused by a dramatic reduction in the number of distinct cpus, operating systems and compilers. However, commercial and personal interests continue to drive the creation of new cpus, operating systems, languages and frameworks.
The reduction in diversity has made it cheaper to make libraries/packages more widely available, and reduced the variety of glue coding patterns. However, while glue code contains many common usage patterns, they tend not to be sufficiently substantial or distinct enough for a cost-effective reuse solution to be readily apparent.
The information available on developer question/answer sites, such as Stackoverflow, provides one form of reuse sharing for glue code.
The huge amounts of source code containing shared usage patterns are great training input for large languages models, and widespread developer interest in these patterns means that the responses from these trained models is of immediate practical use for many developers.
LLMs appear to be the long sought cost-effective solution to the technical problem of code reuse; it’s too early to say what impact licensing issues will have on widespread adoption.
One consequence of widespread LLM usage is a slowing of the adoption of new packages, because LLMs will not know anything about them. LLMs are also the death knell for fashionable new languages, which is a very good thing.
Distribution of binary operator results
As numeric values percolate through a program they appear as the operands of arithmetic operators whose results are new values. What is the distribution of binary operator result values, for a given distribution of operand values?
If we start with independent random values drawn from a uniform distribution,  , then:
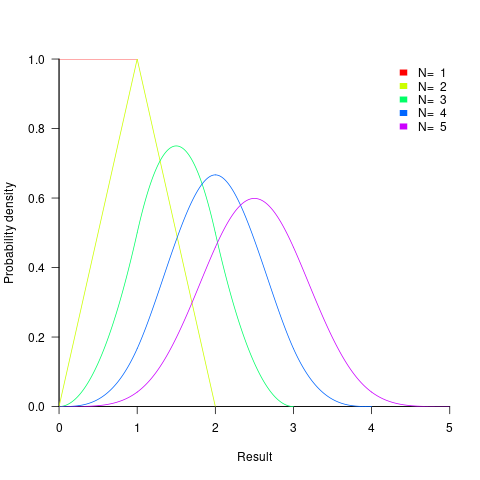
- the distribution of the result of adding two such values has a triangle distribution, and the result distribution from adding
 such values is known as the Irwin-Hall distribution (a polynomial whose highest power is
  ). The following plot shows the probability density of the result of adding 1, 2, 3, 4, and 5 such values (code+data):
- the distribution of the result of multiplying two such values has a logarithmic distribution, and when multiplying such values the probability of the result being
 is:
is: ^{N-1}/{(N-1)!}") .
.
If the operand values have a lognormal distribution, then the result also has a lognormal distribution. It is sometimes possible to find a closed form expression for operand values having other distributions.
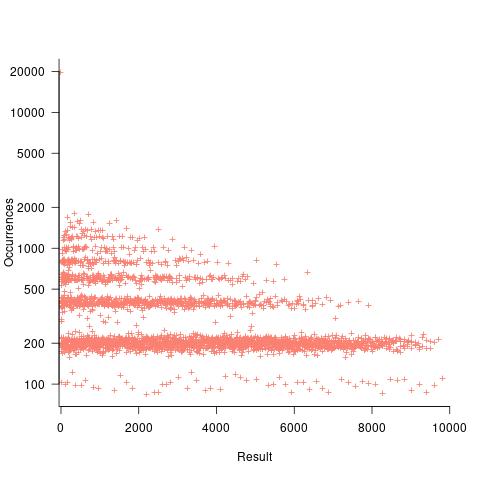
If both operands take integer values, including zero, some result values are more likely to occur than others; for instance, there are six unique factor pairs of positive integers that when multiplied return sixty, and of course prime numbers only have one factor-pair. The following plot was created by randomly generating one million pairs of values between 0 and 100 from a uniform distribution, multiplying each pair, and counting the occurrences of each result value (code+data):
- the probability of the result of dividing two such values being is: 0.5 when
 , and
, and  when
when  .
.
The ratio of two distributions is known as a ratio distribution. Given the prevalence of Normal distributions, their ratio distribution is of particular interest, it is a Cauchy distribution:
}") ,
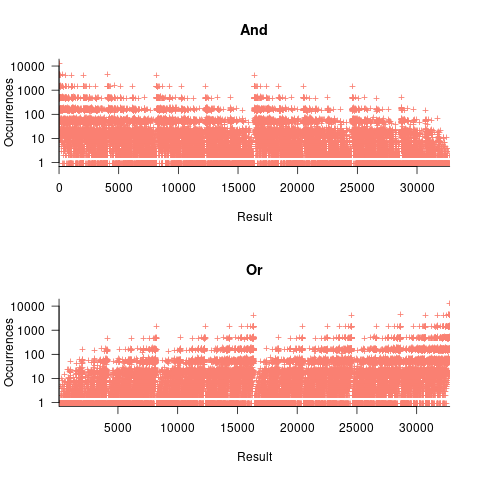
, - the result distribution of the bitwise and/or operators is not continuous. The following plots were created by randomly generating one million pairs of values between 0 and 32,767 from a uniform distribution, performing a bitwise AND or OR, and counting the occurrences of each value (code+data):
- the result distribution of the bitwise exclusive-or operator is uniform, when the distribution of its two operands is uniform.
The mean value of the Irwin-Hall distribution is  and its standard deviation is
  . As
. As  , the Irwin-Hall distribution converges to the Normal distribution; the difference between the distributions is approximately:
 ^N") .
.
The sum of two or more independent random variables is the convolution of their individual distributions,
The banding around intervals of 100 is the result of values having multiple factor pairs. The approximately 20,000 zero results are from two sets of  multiplications where one operand is zero,
The vertical comb structure is driven by power-of-two bits being set/or not. For bitwise-and the analysis is based on the probability of corresponding bits in both operands being set, e.g., there is a 50% chance of any bit being set when randomly selecting a numeric value, and for bitwise-and there is a 25% chance that both operands will have corresponding bits set; numeric values with a single-bit set are the most likely, with two bits set the next most likely, and so on. For bitwise-or the analysis is based on corresponding operand bits not being set,
The general pattern is that sequences of addition produce a centralizing value, sequences of multiplies a very skewed distribution, and bitwise operations combed patterns with power-of-two boundaries.
This analysis is of sequences of the same operator, which have known closed-form solutions. In practice, sequences will involve different operators. Simulation is probably the most effective way of finding the result distributions.
How many operations is a value likely to appear as an operand? Apart from loop counters, I suspect very few. However, I am not aware of any data that tracked this information (Daikon is one tool that might be used to obtain this information), and then there is the perennial problem of knowing the input distribution.
How much productive work does a developer do?
Measuring develop productivity is a nightmare issue that I do my best to avoid.
Study after study has found that workers organise their work to suit themselves. Why should software developers be any different?
Studies of worker performance invariably find that the rate of work is higher when workers are being watched by researchers/managers; this behavior is known as the Hawthorne effect. These studies invariably involve some form of production line work involving repetitive activities. Time is a performance metric that is easy to measure for repetitive activities, and directly relatable to management interests.
A study by Bernstein found that production line workers slowed down when observed by management. On the production line studied, it was not possible to get the work done in the allotted time using the management prescribed techniques, so workers found more efficient techniques that were used when management were not watching.
I have worked on projects where senior management decreed that development was to be done according to some latest project management technique. Developers quickly found that the decreed technique was preventing work being completed on time, so ignored it while keeping up a facade to keep management happy (who appeared to be well aware of what was going on). Other developers have told me of similar experiences.
Studies of software developer performance often implicitly assume that whatever the workers (i.e., developers) say must be so; there is no thought given to the possibility that the workers are promoting work processes that suits their interests and not managements.
Just like workers in other industries, software developers can be lazy, lack interest in doing a good job, unprofessional, a slacker, etc.
Hard-working, diligent developers can be just as likely as the slackers, to organise work to suit themselves. A good example of this is adding product features that the developer wants to add, rather than features that the customer wants to use, or working on features/performance that exceed the original requirements (known as gold plating in other industries).
Developers will lobby for projects to use the latest language/package/GUI/tools in their work. While issues around customer/employer cost/benefit might be cited as a consideration, evidence, in the form of a cost/benefit analysis, is not usually given.
Like most people, developers want others to have a good opinion of them. As writers, of code, developers can attach a lot of weight to how its quality will be perceived by other developer. One consequence of this is a willingness to regularly spend time polishing good-enough code. An economic cost/benefit of refactoring is rarely a consideration.
The first step of finding out if developers are doing productive work is finding out what they are doing, or even better, planning in some detail what they should be doing.
Developers are not alone in disliking having their activities constrained by detailed plans. Detailed plans imply some form of estimates, and people really hate making estimates.
My view of the rationale for estimating in story points (i.e., monopoly money) is that they relieve the major developer pushback on estimating, while allowing management to continue to create short-term (e.g., two weeks) plans. The assumption made is that the existence of detailed plans reduces worker wiggle-room for engaging in self-interest work.
Percolation of the impact of coding mistakes through a program
Programs containing serious coding mistakes can sometimes work surprisingly well. Experienced developers invariably have a story to tell about a program in production use that contained a coding mistake so bad, that it should have prevented the program producing any reliably output. My story relates to a Z80 cpu emulator I had written, which was successfully booting/running CP/M and several applications. One application was sometimes behaving erratically. I eventually traced the problem to the implementation of one of the add instructions (there are 13 special cases), which had been cut/pasted from the implementation of the corresponding subtract instruction, except that I had forgotten to change the result calculation from using a subtract to using an add, i.e., the instruction was performing a subtract, not an add. I was flabbergasted that so much emulated code appeared to be working in the presence of what to me was a crippling coding mistake.
There have been a handful of studies investigating the ability of programs containing coding mistakes to function correctly, or at least well enough to be usable.
- The earliest paper I have found is from 2005; Rinard, Cadar and Nguyen changed the termination condition of 326
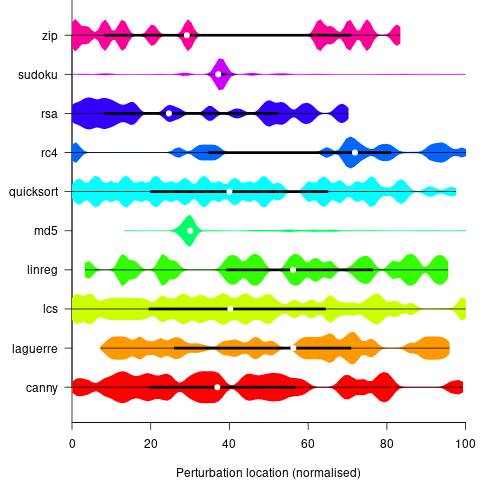
for-loopsin the Pine email client, with<becoming<=, and>becoming>=. While the resulting program exhibited obvious anomalies, the researchers were able to use it to send and receive email, - a study by Danglot, Preux, Baudry and Monperrus investigated the propagation of single perturbations in 10 short Java programs (42 to 568 LOC, perturbed by adding/subtracting 1 from an expression somewhere in the code). The plot below shows the likelihood that a perturbation at some point in the code will have no impact on the output; code+data,
- a study by Cho of the impact of soft errors (i.e., radiation induced bit-flips) found that over 80% of bit-flips had no detectable impact on program behavior.
This week I attended the 63rd CREST Open Workshop; the topic was genetic improvement of software, i.e., GI randomly combines members of a population of programs, only keeping the children that pass some fitness test, rinses and repeats until one or more programs reach some acceptance threshold.
The GI community recently discovered that program output is often unaffected by a small perturbation to program execution, e.g., randomly adding one to the result of a binary operation.
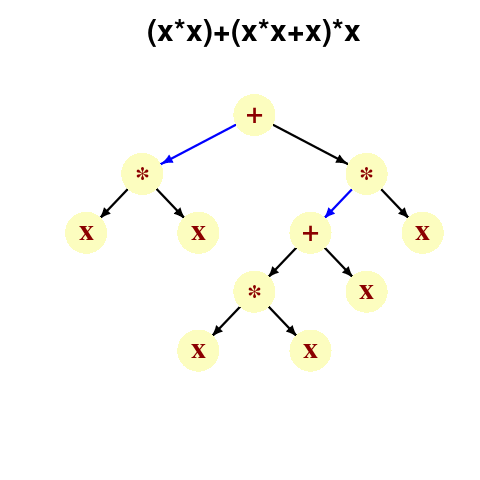
A study by Langdon, Al-Subaihin and Clark tracked the effect of perturbations in the evaluation of an expression tree. The expression trees were created using genetic programming, with the fitness function being the difference between the value obtained by evaluating the expression tree and a sixth order polynomial. The binary operators in the expression tree were multiply and addition, with the leaf node value, x, taking a value between -0.97789 and 0.979541; the trees were a lot deeper than the one below, containing between 8.9k and 863k nodes/leafs, with tree depth varying from 121 to 5,103.
During the evaluation of an expression tree the result of one of the multiply/add operations was perturbed by adding one to its value. The subsequent evaluation of the remainder of the expression tree was tracked, comparing original/perturbed calculated values until either the root node was reached (and the final result was different), or the original/perturbed subtree result values synchronized, i.e., became the same. The distance, in nodes, between perturbation and value synchronization was recorded.
In all, ten expression trees were created, and each node in every tree was perturbed once per run; there were 10 runs using 10 different values of x.
The plot below shows results from two expression trees (different colors). Each point is the distance before original/perturbed values synchronised (for those cases where this happened) against the number of runs having this distance (for the same tree; code+data, and thanks to Bill for explaining things):
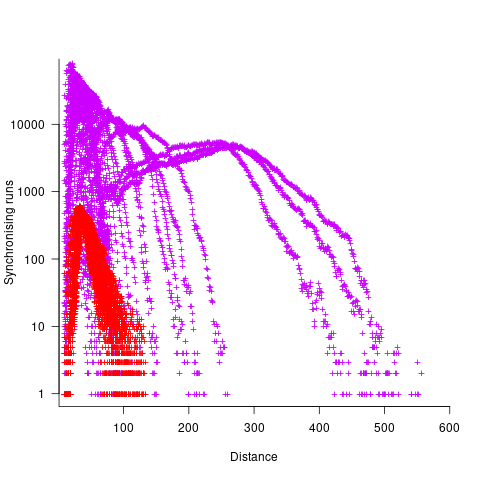
For the larger tree, there is a distinct pattern for each of the ten input values, x. This shows that synchronisation distance can be affected by the input value (which is to be expected). Perhaps this pattern is not present in the smaller tree, or the points are too close together to see it.
The opportunities available to a perturbation for travelling some distance depends on the size and characteristics of the expression tree, with a large thin tree providing more opportunities for longer distance travel than a large bushy tree.
It will take some well thought through experiments to unpick the contributions made by the tree characteristics, problem characteristics, and the prevalence of binary operators unlikely to be affected by small changes to their operand value, e.g., there is roughly a 50% chance that a relational comparison will be unaffected by a small change to one of its operands.
If you know of any other studies investigating coding mistake percolation, please let me know.
Recent Comments