Computer: Plot the data
Last Saturday I attended my first 24-hour hackathon in over 5-years (as far as I know, also the first 24-hour hackathon in London since COVID); the GenAI Hackathon.
I had a great idea for the tool to build. Readers will be familiar with the scene in sci-fi films where somebody says “Computer: Plot the data”, and a plot appears on the appropriate screen. I planned to implement this plot-the-data app using LLMs.
The easy option is to use speech to text, using something like OpenAI’s Whisper, as a front-end to a conventional plotting program. The hard option is to also use an LLM to generate the code needed to create the plot; I planned to do it the hard way.
My plan was to structure the internal functionality using langchain tools and agents. langchain can generate Python and execute this code.
I decided to get the plotting working first, and then add support for speech input. With six lines of Python I created a program that works every now and again; here is the code (which assumes that the environment variable OPENAI_API_KEY has been set to a valid OpenAI API key; the function create_csv_agent is provided by langchain):
from langchain.agents import create_csv_agent from langchain.llms import OpenAI import pandas agent = create_csv_agent(OpenAI(temperature=0.0, verbose=True), "aug-oct_day_items.csv", verbose=True) agent.run("Plot the Aug column against Oct column.") |
Sometimes this program figures out that it needs to call matplotlib to display the data, sometimes its output is a set of instructions for how this plot functionality could be implemented, sometimes multiple plots appear (with lines connecting points, and/or a scatter plot).
Like me, and others, readers who have scratched the surface of LLMs have read that setting the argument temperature=0.0 ensures that the output is always the same. In theory this is true, but in practice the implementation of LLMs contains some intrinsic non-determinism.
The behavior can be made more consistent by giving explicit instructions (just like dealing with humans). I prefixed the user input instructions to use matplotlib, use column names as the axis labels, and to generate a scatter plot, finally a request to display the plot is appended.
In the following code, the first call to plot_data specifies the ‘two month columns’, and the appropriate columns are selected from the csv file.
from langchain.agents import create_csv_agent from langchain.llms import OpenAI import pandas def plot_data(file_str, usr_str): agent = create_csv_agent(OpenAI(temperature=0.0, model_name="text-davinci-003", verbose=True), file_str, verbose=True) plot_txt="Use matplotlib to plot data and" +\ " use the column names for axis labels." +\ " I want you to create a scatter " +\ usr_str + " Display the plot." agent.run(plot_txt) plot_data("aug-oct_day_items.csv", "plot using the two month columns.") plot_data("task-est-act.csv", "plot using the estimates and actuals.") plot_data("task-est-act.csv", "plot the estimates and actuals using a logarithmic scale.") |
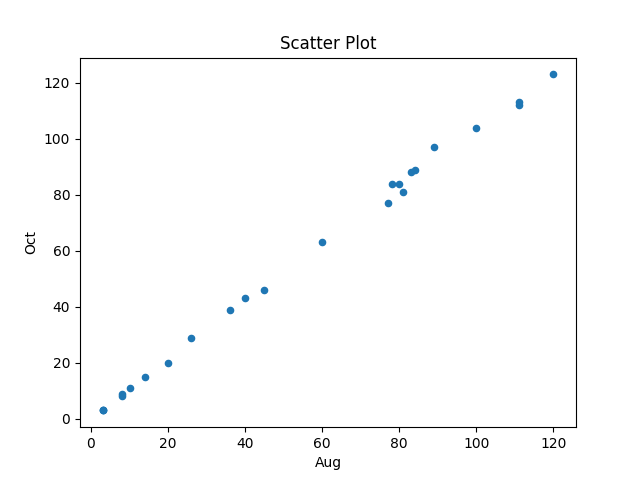
The first call to plot_data worked as expected, producing the following plot (code+data):
The second call failed with an ‘internal’ error. The generated Python has incorrect indentation:
IndentationError: unexpected indent (<unknown>, line 2) I need to make sure I have the correct indentation. |
While the langchain agent states what it needs to do to correct the error, it repeats the same mistake several times before giving up.
Like a well-trained developer, I set about trying different options (e.g., changing the language model) and searching various question/answer sites. No luck.
Finally, I broke with software developer behavior and added the line “Use the same indentation for each python statement.” to the prompt. Prompt engineering behavior is to explicitly tell the LLM what to do, not to fiddle with configuration options.
So now the second call to plot_data works, and the third call sometimes does odd things.
At the hack I failed to convince anybody else to work on this project with me. So I joined another project and helped out (they were very competent and did not really need my help), while fiddling with the Plot-the-data idea.
The code+test data is in the Plot-the-data Github repo. Pull requests welcome.
Recent Comments