Archive
Chinese research in software engineering
China and the Future of Science is the title of a recent article on the blog The Scholar’s Stage. In a series of posts the author, Tanner Greer, has been discussing how Chairman Xi and the Chinese central committee have reoriented the party towards a new goal. In 2026, the aim of China’s communist enterprise is to lead humanity through what they call “the next round of techno scientific revolution and industrial transformation.”.
The Chinese view is that: the first industrial revolution happened in Britain, which was the most powerful country of the 19th century; the second and third (computers) industrial revolutions happened in the USA, which was the most powerful country of the 20th century; the fourth industrial revolution is going to happen in China, which is going to be the most powerful country of the 21st century.
This is a software engineering blog, so I will leave the discussion of any fourth industrial revolution and whether China will lead it to others.
One practical consequence of the Chinese central committee’s focus is lots of funding for science/engineering research, and Chinese academics incentivised to do world-class work. How do you measure an individual’s or institution’s research performance? The Chinese have adopted the Western metric, i.e., counting papers published (weighted by journal impact factor) and number of citations. In 2025, eight of the top ten universities in the CWTS Leiden Ranking are Chinese, with the top western university in the number three spot and the other appearing at number ten. In 2005, six of the top ten universities were in the US.
In a post reviewing software engineering in 2023, I said: “it was very noticeable that many of the authors of papers at major conferences had Asian names. I would say that, on average, papers with Asian author names were better than papers by authors with non-Asian names.”
If software engineering researchers in China are publishing highly cited papers, why am I not seeing blog posts discussing them or hearing people talk about them? The answer is the same for Chinese and Western papers, i.e., little or no industrial relevance (when I point this out to academics they tell me that their work will be found to be relevant in years to come; ha ha {at least in software engineering}).
I label much of the research in software engineering as butterfly-collecting, in the sense that project source code is collected (often via GitHub) and various characteristics are measured and discussed. Much like the biological world was studied 200 years ago. There is no over arching theory, or attempt to model the relationships between different collections.
The incentives have pushed Chinese researchers, in software engineering, to become better butterfly collectors than Western researchers. Also, like Western researchers, they are mostly analysing the data using pre-computer statistical techniques.
If the aim is to publish papers and attract citations, it makes sense for Chinese researchers to study the same topics as Western researchers and analyse the data using the same (pre-computer) statistical techniques. Papers are more likely to be accepted for publication by Westerner reviewers when the subject matter is familiar to those reviewers. There are many tales of researchers having problems publishing papers that introduce new ideas and techniques.
The Central committee don’t just want to appear to be leading the world in engineering research, they want the Chinese to be making the discoveries that enable China to be the most powerful country in the world. For software engineering this means some Chinese researchers must stop following the research agenda set by their Western counterparts, and start asking “what are the important problems in software engineering“, and then researching those problems. If they are effective, a few will be enough.
My Evidence-based Software Engineering book lists and organises some of possible questions to ask, and also contains examples of modern statistical analysis.
China has lots of very good researchers. Perhaps they have all been sucked into the mania vortex around LLMs, and we will have to wait for things to subside. Remember, major discoveries are often made by small group of people.
70% of new software engineering papers on arXiv are LLM related
Subjectively, it feels like LLMs dominate the software engineering research agenda. Are most researchers essentially studying “Using LLMs to do …”? What does the data on papers published since 2022, when LLMs publicly appeared, have to say?
There is usually a year or two delay between doing the research work and the paper describing the work appearing in a peer reviewed conference/journal. Sometimes the researcher loses interest and no paper appears.
Preprint servers offer a fast track to publication. A researcher uploads a paper, and it appears the next day, with a peer reviewed version appearing sometime later (or not at all). Preprint publication data provides the closest approximation to real-time tracking of research topics. arXiv is the major open-access archive for research papers in computing, physics, mathematics and various engineering fields. The software engineering subcategory is cs.SE; every weekday I read the abstracts of the papers that have been uploaded, looking for a ‘gold dust’ paper.
The python package arxivscraper uses the arXiv api to retrieve metadata associated with papers published on the site. A surprisingly short program extracted the 15,899 papers published in the cs.SE subcategory since 1st January 2022.
A paper’s titles had to capture people’s attention using a handful of words. Putting the name of a new tool/concept in the title is likely to attract attention. The three words in the phrase Large Language Model consume a lot of title space, but during startup the abbreviated form (i.e., LLM) may not be generally recognised. The plot below shows the percentage of papers published each month whose title (case-insensitive) is matched either the regular expression “llm” or “large language model” (code and data):

Peak Large Language Model appears to be at the end of 2024. As time goes by new phrases/abbreviations stop being new and attention is grabbed by other phrases. Did peak LLM in titles occur at the end of 2025?
A paper’s abstract summarises its contents and has space for a lot more words. The plot below shows the percentage of papers published each month whose abstract (case-insensitive) is matched by either the regular expression “llm” or “large language model” (code and data):
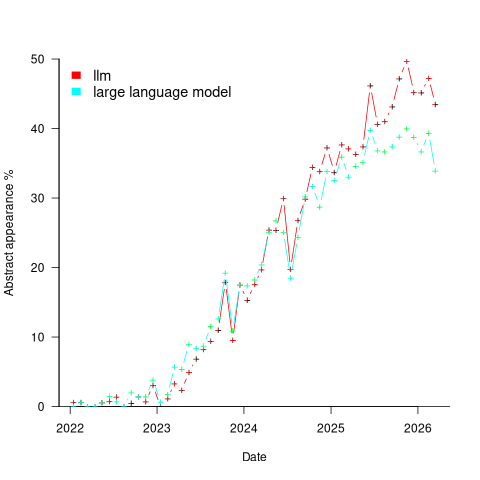
Peak, or plateauing, Large Language Model appears to be towards the end of 2025. Is the end of 2025 a peak of LLM in abstracts, or is it a plateauing with the decline yet to start? We should know by the end of this year.
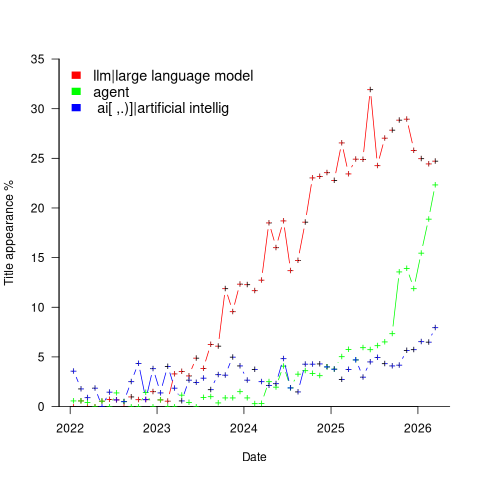
Other phrases associated with LLMs are AI, artificial intelligence and agents. The plot below shows the percentage of papers published each month whose title (case-insensitive) is matched by each of the regular expressions “llm|large language model“, or “ ai[ ,.)]|artificial intellig“, or “agent” (code and data):
Counting the papers containing one or more of these LLM-related phrases gives an estimate of the number of software engineering papers studying this topic. The plot below shows the percentage of papers published each month whose title or abstract (case-insensitive) is matched by one or more of the regular expressions “llm|large language model“, or “ ai[ ,.)]|artificial intellig“, or “agent” (code and data):
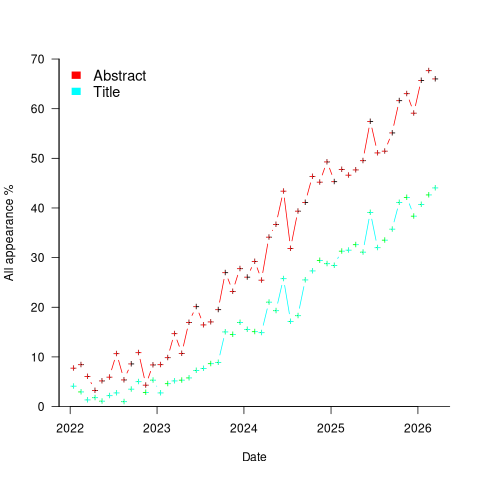
If the rate of growth is unchanged, around 18-month from now 100% of papers published in arXiv’s cs.SE subcategory will be LLM-related.
I expect the rate of growth to slow, and think it will stop before reaching 100% (I was expecting it to be higher than 70% in February). How much higher will it get? No idea, but herd mentality is a powerful force. Perhaps OpenAI going bankrupt will bring researchers to their senses.
Update
Martin Monperrus did an agentic replication of the analysis discussed in this post!
Identifier names chosen to hold the same information
Identifier naming is a contentious issue dominated by opinions and existing habits, with almost no experimental evidence (rather like software engineering practices in general).
One study found that around 40% of all non-white-space characters in the visible source of C programs are identifiers (comments representing 31% of the characters in the .c files), representing 29% of the visible tokens in the .c files.
Some years ago I spent a long time studying the word related experiments run by psychologists, looking for possible parallels with identifier usage. The crucial identifier naming factor is the semantic associations a name triggers in the reader’s mind. Choosing a name requires making a cost-benefit tradeoff. The greater quantity of information that might be communicated by longer names has to be balanced against both the cost of reading the name and ignoring the name when searching for other information.
The semantic association network present in a person’s head is the result of the words they have encountered and the context in which they were encountered. Different people are likely to make different associations. Shared culture and experiences increases the likelihood of shared naming associations.
A study by Nelson, McEvoy, and Schreiber gave subjects (over time, 6,000 students at the University of South Florida) a booklet containing 100 words, and asked them to write down the first word that came to mind that was meaningfully related or strongly associated to each of these words (data here, a total of 612,627 responses to 5,024 distinct words). The mean number of different responses to the same word was 14.4, with a standard deviation of 5.2.
There are patterns in the names of identifiers. For instance, operands of bitwise and logical operators have names that include words whose semantics is associated with the operations usually performed by these operands, such as: flag, status, state, and mask. One experiment (with a small sample size) found that developers make use of operand names to make operator precedence decisions.
A study by Feitelson, Mizrahi, Noy, Shabat, Eliyahu, and Sheffer, investigated the variable names chosen by developers to hold specific information. The 334 subjects (students and professional developers) were asked to suggest a name for a variable, constant, or data structure based on a description of the information it would contain, plus other questions relating to interpreting the semantics associated with a name.
The authors cite a problem that I think is actually a benefit: “A major problem in studying spontaneous naming is that the description of the context and the question itself necessarily use words.” When writing code a well-chosen name communications information about the context, which helps readers understand what is going on. The authors’ solution to this perceived problem was to give the description in either Hebrew or English (the subjects were native Hebrew speakers who are fluent in English), with subjects providing the name in English.
The answers to the 21 name generation questions had a mean of 53 distinct names (standard deviation 20.2; code and data). The table below shows the names chosen and the number of subjects choosing that name after seeing the description in Hebrew or English, for one of the questions.
Name Hebrew English b_elevator_door_state 1 b_is_door_open 1 curr_state 2 current_doors_state 1 door 3 1 door_current_status 1 door_is_closed 1 door_is_open 1 door_open 3 door_stat 1 door_state 10 12 door_status 4 doorstate 1 1 elevator_door_state 1 1 elevator_state 1 is_closed 1 1 is_door_closed 2 1 is_door_open 11 3 is_door_opened 2 2 is_elevator_open 1 is_o_pen 1 is_open 7 5 is_opened 2 state 1 status 1 status_of_door 1 |
While the names are distinct, some only differ by a permutation of words, e.g., door_is_open and is_door_open, or with one word missing, e.g., door_open and is_open, or two words missing, e.g., door.
If subjects are influenced by the description (e.g., using the word ordering that appears in the description, or only words from the description), the number of unique names would be smaller than if there was no such influence. The impact of influence would be that subjects seeing the English descriptions are likely to produce fewer unique names.
In 13 out of 21 questions, Hebrew subjects produced more unique names. However, a bootstrap test shows that the difference is not statistically significant.
I think a big threat to the validity of the study is only having subjects create one name. Writing software involves creating names for many variables, which has different cost-benefit tradeoffs than when creating a single variable. The names within a program share a common context and developers tend to follow informal patterns so that naming within the code has some degree of consistency. Adhering to these patterns restricts the possible set of names that might be chosen. Also, the existing use of a name may prevent it being reused for a new variable.
Programming competitions are one source for variable names implementing the same specification, at least for short program. Longer programs are more likely to have some variation in the algorithms used to implement the same functionality.
I expect greater consistency of identifier name selection within an LLM than across developers. LLM training will direct them down existing common patterns of usage, plus some random component.
Analysis of some C/C++ source file characteristics
Source code is contained in files within a file-system. However, source files as an entity are very rarely studied. The largest structural source code entities commonly studied are functions/methods/classes, which are stored within files.
To some extent this lack of research is understandable. In object-oriented languages one class per file appears to be a natural fit, at least for C++ and Java (I have not looked at other OO languages). In non-OO languages the clustering of functions/procedures/subroutines within a file appears to be one of developer convenience, or happenstance. Functions that are created/worked on together are in the same file because, I assume, this is the path of least resistance. At some future time functions may be moved to another file, or files split into smaller files.
What patterns are there in the way that files are organised within directories and subdirectories? Some developers keep everything within a single directory, while others cluster files by perceived functionality into various subdirectories. Program size is a factor here. Lots of subdirectories appears somewhat bureaucratic for small projects, and no subdirectories would be chaotic for large projects.
In general, there was little understanding of how files were typically organised, by users, within file-systems until around late 2000. Benchmarking of file-system performance was based on copies of the files/directories of a few shared file-systems. A 2009 paper uncovered the common usage patterns needed for generating realistic file-systems for benchmarking.
The following analysis investigates patterns in the source files and their contained functions in C/C++ programs. The information was extracted from 426 GitHub projects using CodeQL.
The 426 repos contained 116,169 C/C++ source files, which contained 29,721,070 function definitions. Which files contained C source and which C++? File name suffix provides a close approximation. The table below lists the top-10 suffixes:
   Suffix   Occurrences   Percent
     .c        53,931       46.4
     .cpp      49,621       42.7
     .cc        7,699        6.6
     .cxx       2,616        2.3
     .I           965        0.8
     .inl         403        0.3
     .ipp         400        0.3
     .inc         159        0.1
     .c++         136        0.1
.ic 128 0.1 |
CodeQL analysis can provide linkage information, i.e., whether a function is defined with C linkage. I used this information to distinguish C from C++ source because it is simpler than deciding which suffix is most likely to correspond to which language. It produced 56,002 files classified as containing C source.
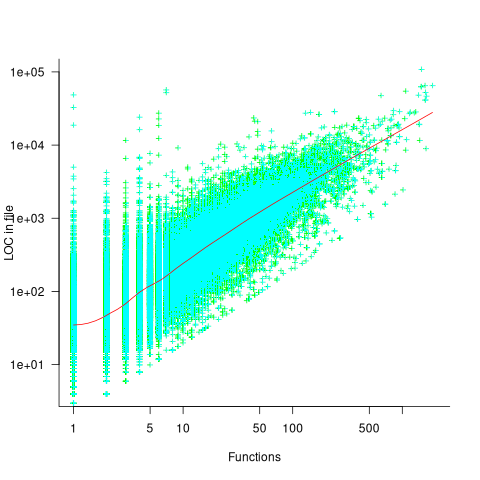
The full path to around 9% of files includes a subdirectory whose name is test/, tests/, or testcases/. Based on the (perhaps incorrect) belief that the characteristics of test files are different from source files, files contained under such directories were labelled test files. The plot below shows the number of files containing a given number of function definitions, with fitted power laws over two ranges (code and data):
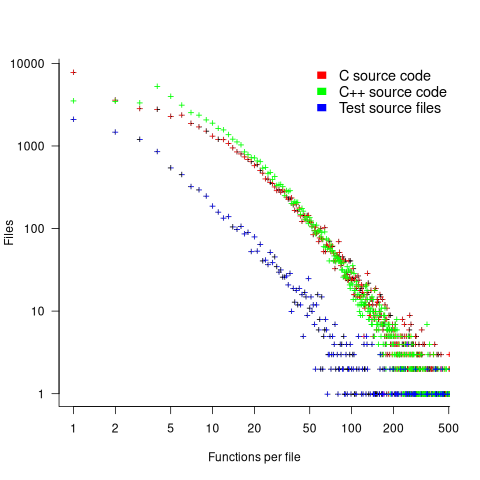
The shape of the file/function distribution is very surprising. I had not expected the majority of C files to contain a single function. For C++ there are two regions, with roughly the same number of files containing 1, 2, or 3 functions, and a smooth decline for files containing four or more methods (presumably most of these are contained in a class).
For C, C++ and test files, a power law could be fitted over a range of functions-per-file, e.g., between 6 and 2 for C, or between 4 and 2 for C++, or between 20 and 100 for C/C++, or 3 and more for test files. However, I have a suspicion that there is a currently unknown (to me) factor that needs to be adjusted for. Alternatively, I will get over my surprise at the shape of this distribution (files in general have a lognormal size, in bytes, distribution).
For C, C++ and test files, a power law is fitted over a range of functions-per-file, e.g., between 6 and 21 (exponent -1.1), and 22 and 100 (exponent -2) for C, between 4 and 21 (exponent -1.2), and 22 and 100 (exponent -2.2) for C++, between 4 and 50 (exponent -1.7), for test files. Files in general have a lognormal size, in bytes, distribution.
Perhaps a file contains only a few functions when these functions are very long. The plot below shows lines of code contained in files containing a given number of function, with fitted loess regression line in red (code and data):
A fitted regression model has the form  . The number of LOC per function in a file does slowly decrease as the number of functions increases, but the impact is not that large.
How are source files distributed across subdirectories? The plot below shows number of C/C++ files appearing within a subdirectory of a given depth, with fitted Poisson distribution (code and data):
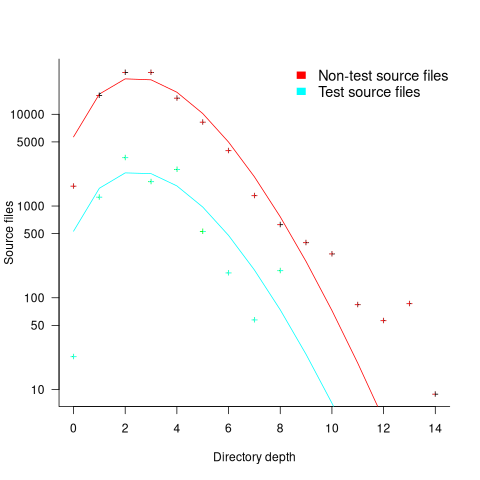
Studies of general file-systems found that number of files at a given subdirectory depth has a Poisson distribution with mean around 6.5. The mean depth for these C/C++ source files is 2.9.
Is this pattern of source file use specific to C/C++, or does it also occur in Java and Python? A question for another post.
Relative performance of computers since the 1990s
What was the range of performance of desktop’ish computers introduced since the 1990s, and what was the annual rate of performance increase (answers for earlier computers)?
Microcomputers based on Intel’s x86 family was decimating most non-niche cpu families by the early 1990s. During this cpu transition a shift to a new benchmark suite followed a few years behind. The SPEC cpu benchmark originated in 1989, followed by a 1992 update, with the 1995 update becoming widely used. Pre-1995 results don’t appear on the SPEC website: “Because SPEC’s processes were paper-based and not electronic back when SPEC CPU 92 was the current benchmark, SPEC does not have any electronic storage of these benchmark results.” Thanks to various groups, some SPEC89/92 results are still available.
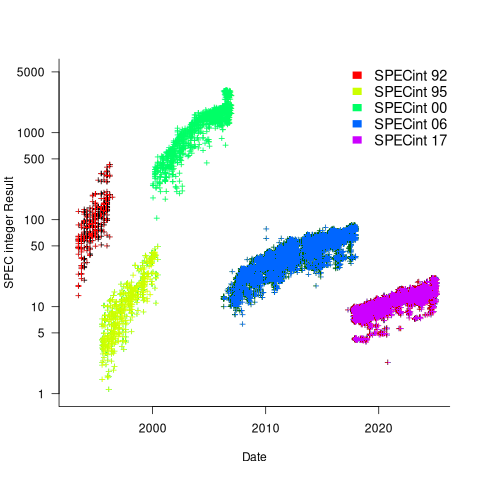
The following analysis uses the results from the SPEC integer benchmarks, which was changed in 1992, 1995, 2000, 2008, and 2017.
Every time a benchmark is changed, the reported results for the same computer change, perhaps by a lot. The plot below shows the results for each version of the benchmark (code+data):
Provide a few conditions are met, it is possible to normalise each set of results, allowing comparisons to be made across benchmark changes. First, results from running, say, both SPEC92 and SPEC95 on some set of computer needs to be available. These paired results can be used to build a model that maps result values from one benchmark to the other. The accuracy of the mapping will depend on there being a consistent pattern of change, i.e., a strong correlation between benchmark results.
The plot below shows the normalised results, along with regression models fitted to each release (code+data):
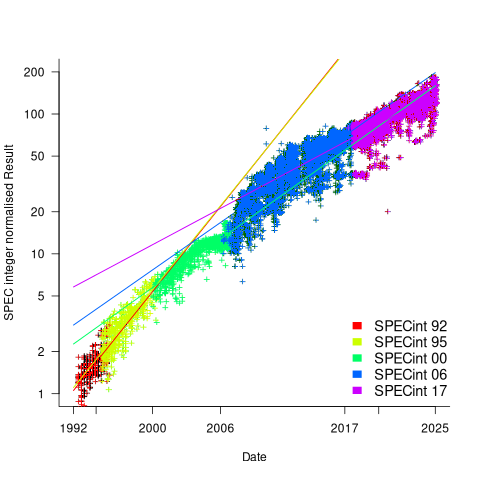
What happened around 2007? Dennard scaling stopped, and there is an obvious meeting of two curves as one epoch transitioned into another. Since 2007 performance improvements have been driven by faster memory, larger caches, and for some applications multiple on-die cpus.
The table below shows the annual growth in SPECint performance for each of the benchmark start years, over their lifetime.
      Year   Annual growth
      1992       26.2%
      1995       25.9%
      2000       14.2%
      2007       13.9%
2017 10.5% |
In 2025, the cpu integer performance of the average desktop system is over 100 times faster than the average 1992 desktop system. With the first factor of 10 improvement in the first 10 years, and the second factor of 10 in the previous 20 years.
Recent Comments