Archive
Analysis of some C/C++ source file characteristics
Source code is contained in files within a file-system. However, source files as an entity are very rarely studied. The largest structural source code entities commonly studied are functions/methods/classes, which are stored within files.
To some extent this lack of research is understandable. In object-oriented languages one class per file appears to be a natural fit, at least for C++ and Java (I have not looked at other OO languages). In non-OO languages the clustering of functions/procedures/subroutines within a file appears to be one of developer convenience, or happenstance. Functions that are created/worked on together are in the same file because, I assume, this is the path of least resistance. At some future time functions may be moved to another file, or files split into smaller files.
What patterns are there in the way that files are organised within directories and subdirectories? Some developers keep everything within a single directory, while others cluster files by perceived functionality into various subdirectories. Program size is a factor here. Lots of subdirectories appears somewhat bureaucratic for small projects, and no subdirectories would be chaotic for large projects.
In general, there was little understanding of how files were typically organised, by users, within file-systems until around late 2000. Benchmarking of file-system performance was based on copies of the files/directories of a few shared file-systems. A 2009 paper uncovered the common usage patterns needed for generating realistic file-systems for benchmarking.
The following analysis investigates patterns in the source files and their contained functions in C/C++ programs. The information was extracted from 426 GitHub projects using CodeQL.
The 426 repos contained 116,169 C/C++ source files, which contained 29,721,070 function definitions. Which files contained C source and which C++? File name suffix provides a close approximation. The table below lists the top-10 suffixes:
   Suffix   Occurrences   Percent
     .c        53,931       46.4
     .cpp      49,621       42.7
     .cc        7,699        6.6
     .cxx       2,616        2.3
     .I           965        0.8
     .inl         403        0.3
     .ipp         400        0.3
     .inc         159        0.1
     .c++         136        0.1
.ic 128 0.1 |
CodeQL analysis can provide linkage information, i.e., whether a function is defined with C linkage. I used this information to distinguish C from C++ source because it is simpler than deciding which suffix is most likely to correspond to which language. It produced 56,002 files classified as containing C source.
The full path to around 9% of files includes a subdirectory whose name is test/, tests/, or testcases/. Based on the (perhaps incorrect) belief that the characteristics of test files are different from source files, files contained under such directories were labelled test files. The plot below shows the number of files containing a given number of function definitions, with fitted power laws over two ranges (code and data):
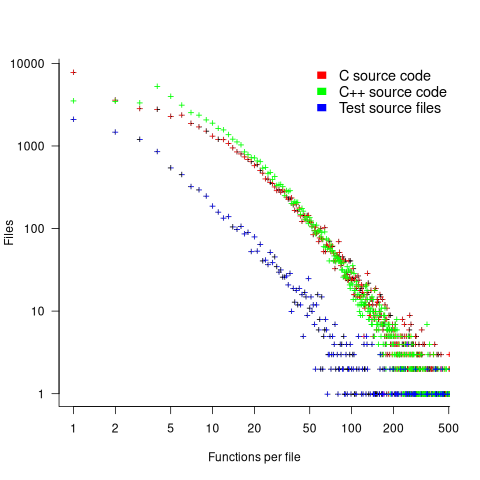
The shape of the file/function distribution is very surprising. I had not expected the majority of C files to contain a single function. For C++ there are two regions, with roughly the same number of files containing 1, 2, or 3 functions, and a smooth decline for files containing four or more methods (presumably most of these are contained in a class).
For C, C++ and test files, a power law could be fitted over a range of functions-per-file, e.g., between 6 and 2 for C, or between 4 and 2 for C++, or between 20 and 100 for C/C++, or 3 and more for test files. However, I have a suspicion that there is a currently unknown (to me) factor that needs to be adjusted for. Alternatively, I will get over my surprise at the shape of this distribution (files in general have a lognormal size, in bytes, distribution).
For C, C++ and test files, a power law is fitted over a range of functions-per-file, e.g., between 6 and 21 (exponent -1.1), and 22 and 100 (exponent -2) for C, between 4 and 21 (exponent -1.2), and 22 and 100 (exponent -2.2) for C++, between 4 and 50 (exponent -1.7), for test files. Files in general have a lognormal size, in bytes, distribution.
Perhaps a file contains only a few functions when these functions are very long. The plot below shows lines of code contained in files containing a given number of function, with fitted loess regression line in red (code and data):
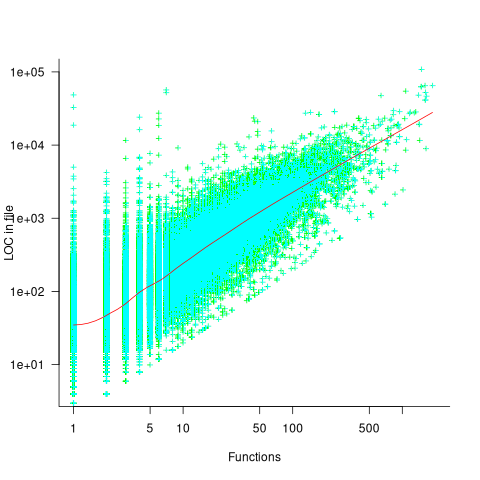
A fitted regression model has the form  . The number of LOC per function in a file does slowly decrease as the number of functions increases, but the impact is not that large.
How are source files distributed across subdirectories? The plot below shows number of C/C++ files appearing within a subdirectory of a given depth, with fitted Poisson distribution (code and data):
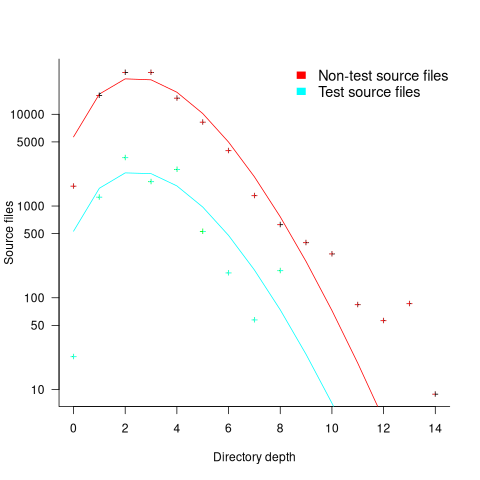
Studies of general file-systems found that number of files at a given subdirectory depth has a Poisson distribution with mean around 6.5. The mean depth for these C/C++ source files is 2.9.
Is this pattern of source file use specific to C/C++, or does it also occur in Java and Python? A question for another post.
Statistical techniques not needed to analyze software engineering data
One of the methods I used to try to work out what statistical techniques were likely to be useful to software developers, was to try to apply techniques that were useful in other areas. Of course, applying techniques requires the appropriate data to apply them to.
Extreme value statistics are used to spot patterns in rare events, e.g., frequency of rivers over spilling their banks and causing extensive flooding. I have tried and failed to find any data where Extreme value theory might be applicable. There probably is some such data, somewhere.
The fact that I have spent a lot of time looking for data and failed to find particular kinds of data, suggests that occurrences are rare. If data needing a particular kind of analysis technique is rare, there is no point including a discussion of the technique in a book aimed at providing general coverage of material.
I have spent some time looking for data drawn from a zero-inflated Poisson distribution. Readers are unlikely to have ever heard of this and might well ask why I would be interested in such an obscure distribution. Well, zero-truncated Poisson distributions crop up regularly (the Poisson distribution applies to count data that starts at zero, when count data starts at one the zeroes are said to be truncated and the Poisson distribution has to be offset to adjust for this). There is a certain symmetry to zero-truncated/inflated (although the mathematics involved is completely different), plus there is probably a sunk cost effect (i.e., I have spent time learning about them, I am going to find the data).
I spotted a plot in a paper investigating record data structure usage in Racket, that looked like it might be well fitted by a zero-inflated Poisson distribution. Tobias Pape kindly sent me the data (number of record data structures having a given size), which I then failed miserably to fit to any kind of Poisson related distribution; see plot below; data points along red line through the plus symbols (code+data):
I can only imagine what the authors thought of my reason for wanting the data (I made data requests to a few other researchers for similar reasons; and again I failed to fit the desired distribution).
I had expected to make more use of time series analysis; but, it has just not been that applicable.
Machine learning is useful for publishing papers, but understanding what is going on is the subject of my book, not building black boxes to make predictions.
It is possible that researchers are not publishing work relating to data that requires statistical techniques I have not used, because they don’t know how to analyze the data or the data is too hard to collect. Inability to use the correct techniques to analyze data is rarely a reason for not publishing a paper. Data being too hard to collect is very believable, as-is the data rarely occurring in software engineering related work.
There are statistical tests I have intentionally ignored, the Mann–Whitney U test (aka, the Wilcoxon rank-sum test) and the t-test probably being the most well-known. These tests became obsolete once computers became generally available. If you are ever stuck on a desert island without a computer, these are the statistical tests you will have to use.
A signature for the “embeddedness” of source code and developers?
Patterns in the use of source code can tell us a lot about the people who wrote the code, the characteristics of the hardware it runs on and what the application is all about.
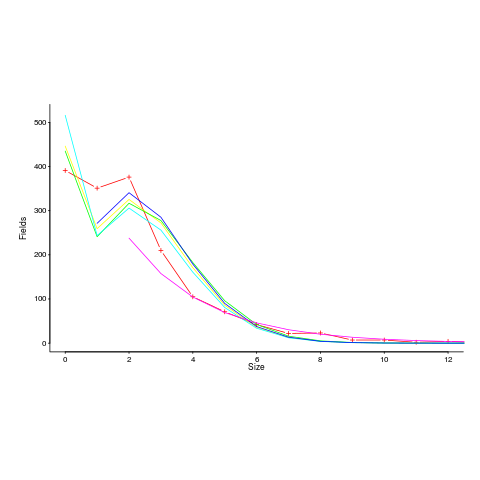
Often the pattern of usage needs a lot of work to understand and many remain completely baffling, but every now and again the forces driving a pattern leap off the page. One such pattern is visible in the plot below; data courtesy of Jacob Engblom and the cbook data is from my C book (assuming you know something about the nitty gritty of embedded software development). It shows the percentage of functions defined to have a given number of parameters:
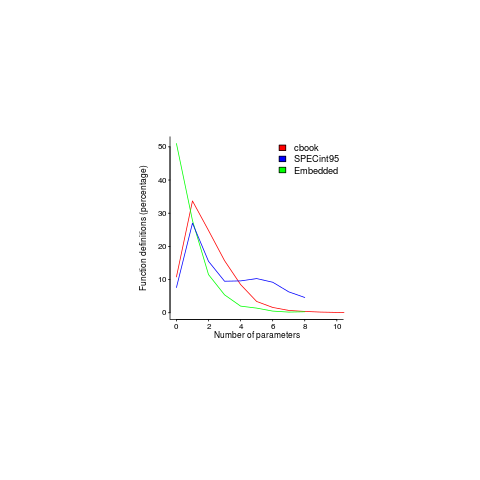
Embedded software has to run in very constrained environments. The hardware is often mass produced and saving a penny per device can add up to big savings, so the cheapest processor is chosen and populated with the smallest possible memory; developers have to work with what they are given. Power consumption may be down below one watt, so clock speeds are closer to 1 MHz than 1 GHz.
Parameter passing is a relatively expensive operation and there are major savings, relatively speaking, to be had by using global variables. Experienced embedded developers know this and this plot is telling us that they are acting on this knowledge.
The following are two ways of interpreting the embedded data (I cannot think of any others that make sense):
- the time/resource critical functions use globals rather than parameters and all the other functions are written more or less the same as in a non-embedded environment. In statistical terms this behavior is described by a zero-inflated model,
- there is pressure on the developer to reduce the number of parameters in all function definitions.
This data contains counts, so a Poisson distribution is the obvious candidate for our model.
My attempts to fit a zero-inflated model failed miserably (code+data). A basic Poisson distribution fitted everything reasonably well (let’s ignore that tiresome bump in the blue line); plus signs are the predictions made from each fitted model.
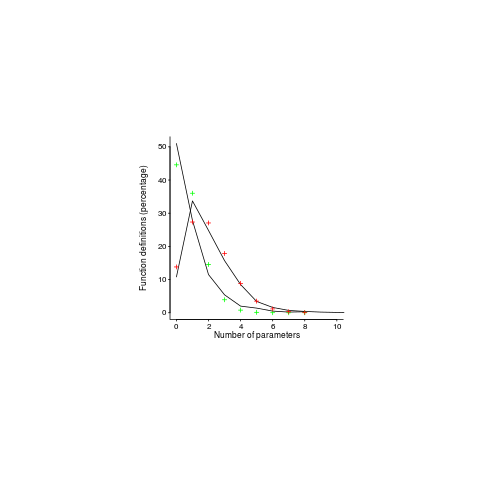
For desktop developers, the distribution of function definitions having a given number of parameters follows a Poisson distribution with a λ of 2, while for embedded developers λ is 0.8.
What about values of λ between 0.8 and 2; perhaps the λ of a project’s, or developer’s, code parameter count can be used as an indicator of ’embeddedness’?
What is needed to parameter count data from a range of 4-bit, 8-bit and 16-bit systems and measurements of developers who have been working in the field for, say, 4, 8, 16 years. Please let me know.
The data is from a Masters thesis written in 1999, is it still relevant today? Have modern companies become kinder to developers and stopped making their life so hard by saving pennies when building mass produced products; are modern low-power devices being used so values can be passed via parameters rather than via globals, or are they being used for applications where even less power is available?
One difference from 20 years ago is that embedded devices are more mainstream, easier to get hold of and sales opportunities abound. This availability creates an environment where developers with a desktop development mentality (which developers new to embedded always seem to have had) don’t get to learn about the overheads of parameter passing.
Have compilers gotten better at reducing the function parameter overhead? The most obvious optimization is inlining a function at the point of call. If the function is only called once, this works fine, with multiple calls the generated code can get larger (one of the things we are trying to avoid). I don’t have any reliable data on modern compiler performance int his area, but then I have not looked hard. Pointers to benchmarks welcome.
Does embedded software have any other signatures that differentiate it from desktop software (other than the obvious one of specifying address in definitions of global variables)? Suggestions welcome.
Recent Comments