Archive
Distribution of number of statements in functions
The source code of individual functions is written a particular way by individuals to solve particular problems. When source code use of programming constructs are counted, in a sufficiently large quantity of source code, various patterns emerge. The most common patterns involve power laws and exponentials. The plot below shows the number of functions containing a given number of lines of code, expression-statements (e.g., assignments, calls whose return value is not used), function calls (which includes calls within an expression), and return-statements for 176,172 C functions, along with fitted power laws (data obtained using GitHub’s CodeQL variant analysis; code+data):
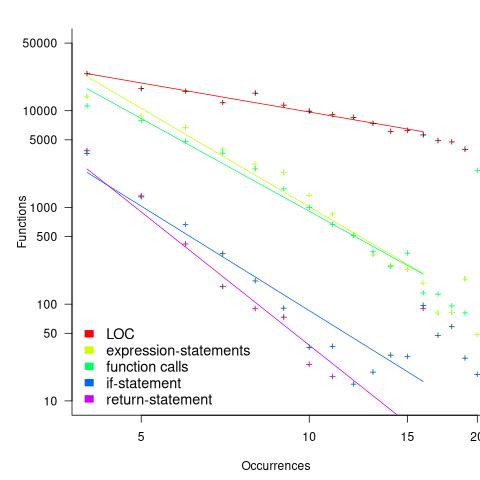
The power law exponents are: LOC 1, expression-statements 3.4, calls 3.2, if-statements 3.6, and return-statements 4.6.
This plot counts uses across all functions, to provide a global perspective. Given the quantity of data available, it’s possible to focus on the characteristics of functions containing a given number of lines of code (LOC), to study patterns of behavior that emerge as functions get longer (it was once thought that there was an optimal function length that minimised the likelihood of fault reports).
Given a function containing  LOC, what is the probability that it will contain
if-statements, or for-statements, or expression-statements, etc? The plots below show the number of if-statements that occur in 176,172 C functions containing each of 4, 5, …, 19 LOC, along with fitted regression lines (code+data):
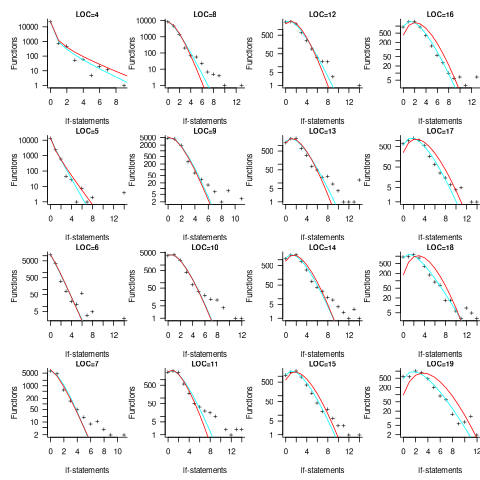
The fitted model is the probability mass function of the negative binomial distribution. The blue/green lines are individual fits to the data in each plot.
The negative binomial distribution is usually described in terms of the probability of  events occurring (or not occurring) in a sequence of
  tries, e.g., rolling two 6’s in five attempts. In a function context, this can be interpreted as the probability that there will be occurrences of a particular statement in the LOC of the function’s code.
There are various ways of specifying a negative binomial distribution. The data was fitted using R’s gamlss package, which uses the two parameters: mean ( ) and dispersion (
 ).
).
As functions get longer (i.e., LOC increases), they are more likely to contain more of each kind of statement (i.e., the mean will increase), and the variability is also likely to increase. In other words, the parameters and will increase with LOC. The red line in each plot are derived from a fitted negative binomial distribution with:  and
and  , where the values
  ,
,  ,
,  , and
, and  are returned by the fitting process (this equation was found by inspired guessing/some trial and error; another possibility is:
 , and
, and  ). This LOC dependent fits (in red) closely follow the bespoke fits (in blue/green), and for larger LOC are not affected by noisy data points.
Being able to fit a single model to the data over a range of LOCs shows that a consistent pattern of behavior exists. Similar models can be built for number of calls, while-statements, expression-statements and number of local variables. The model of for-statements suffered from high variability counts, and return-statements counts grew too slowly over the range of LOC analysed.
If the number of if-statements, say, within functions of a given size has a negative binomial distribution, then adding together all these distributions, weighted by the number of functions at a given size, should produce a power law whose exponent matches that found in the first plot (i.e., 3.6).
I asked ChatGPT: “If $y(k, x)=a*x^{-b}*NB(k; mu=log(x), sigma=log(x))$ where: $NB$ is the probability mass of the negative binomial distribution, $mu$ is its mean and $x$ takes positive integer values, $a$ is a positive constant, and $1 < b < 3$. Show that the series $sum_{x=3}^14 y(k, x)$i for $0 < k < 10$ is approximately a power law." and obtained the response that the exponent was approximately  (i.e., about 2), which is not close.
The responses from other LLMs were not any better. The calculation requires various simplifying assumptions (all the models resorted to numerical simulation at some point), and these need to be checked.
Analysis of some C/C++ source file characteristics
Source code is contained in files within a file-system. However, source files as an entity are very rarely studied. The largest structural source code entities commonly studied are functions/methods/classes, which are stored within files.
To some extent this lack of research is understandable. In object-oriented languages one class per file appears to be a natural fit, at least for C++ and Java (I have not looked at other OO languages). In non-OO languages the clustering of functions/procedures/subroutines within a file appears to be one of developer convenience, or happenstance. Functions that are created/worked on together are in the same file because, I assume, this is the path of least resistance. At some future time functions may be moved to another file, or files split into smaller files.
What patterns are there in the way that files are organised within directories and subdirectories? Some developers keep everything within a single directory, while others cluster files by perceived functionality into various subdirectories. Program size is a factor here. Lots of subdirectories appears somewhat bureaucratic for small projects, and no subdirectories would be chaotic for large projects.
In general, there was little understanding of how files were typically organised, by users, within file-systems until around late 2000. Benchmarking of file-system performance was based on copies of the files/directories of a few shared file-systems. A 2009 paper uncovered the common usage patterns needed for generating realistic file-systems for benchmarking.
The following analysis investigates patterns in the source files and their contained functions in C/C++ programs. The information was extracted from 426 GitHub projects using CodeQL.
The 426 repos contained 116,169 C/C++ source files, which contained 29,721,070 function definitions. Which files contained C source and which C++? File name suffix provides a close approximation. The table below lists the top-10 suffixes:
   Suffix   Occurrences   Percent
     .c        53,931       46.4
     .cpp      49,621       42.7
     .cc        7,699        6.6
     .cxx       2,616        2.3
     .I           965        0.8
     .inl         403        0.3
     .ipp         400        0.3
     .inc         159        0.1
     .c++         136        0.1
.ic 128 0.1 |
CodeQL analysis can provide linkage information, i.e., whether a function is defined with C linkage. I used this information to distinguish C from C++ source because it is simpler than deciding which suffix is most likely to correspond to which language. It produced 56,002 files classified as containing C source.
The full path to around 9% of files includes a subdirectory whose name is test/, tests/, or testcases/. Based on the (perhaps incorrect) belief that the characteristics of test files are different from source files, files contained under such directories were labelled test files. The plot below shows the number of files containing a given number of function definitions, with fitted power laws over two ranges (code and data):
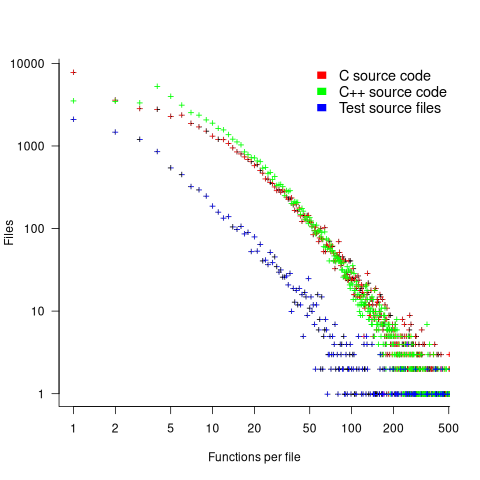
The shape of the file/function distribution is very surprising. I had not expected the majority of C files to contain a single function. For C++ there are two regions, with roughly the same number of files containing 1, 2, or 3 functions, and a smooth decline for files containing four or more methods (presumably most of these are contained in a class).
For C, C++ and test files, a power law could be fitted over a range of functions-per-file, e.g., between 6 and 2 for C, or between 4 and 2 for C++, or between 20 and 100 for C/C++, or 3 and more for test files. However, I have a suspicion that there is a currently unknown (to me) factor that needs to be adjusted for. Alternatively, I will get over my surprise at the shape of this distribution (files in general have a lognormal size, in bytes, distribution).
For C, C++ and test files, a power law is fitted over a range of functions-per-file, e.g., between 6 and 21 (exponent -1.1), and 22 and 100 (exponent -2) for C, between 4 and 21 (exponent -1.2), and 22 and 100 (exponent -2.2) for C++, between 4 and 50 (exponent -1.7), for test files. Files in general have a lognormal size, in bytes, distribution.
Perhaps a file contains only a few functions when these functions are very long. The plot below shows lines of code contained in files containing a given number of function, with fitted loess regression line in red (code and data):
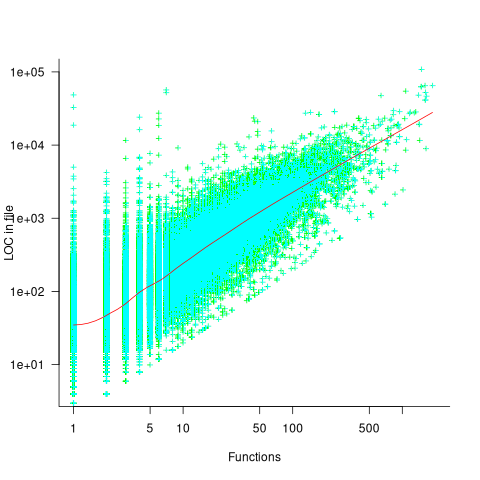
A fitted regression model has the form  . The number of LOC per function in a file does slowly decrease as the number of functions increases, but the impact is not that large.
How are source files distributed across subdirectories? The plot below shows number of C/C++ files appearing within a subdirectory of a given depth, with fitted Poisson distribution (code and data):
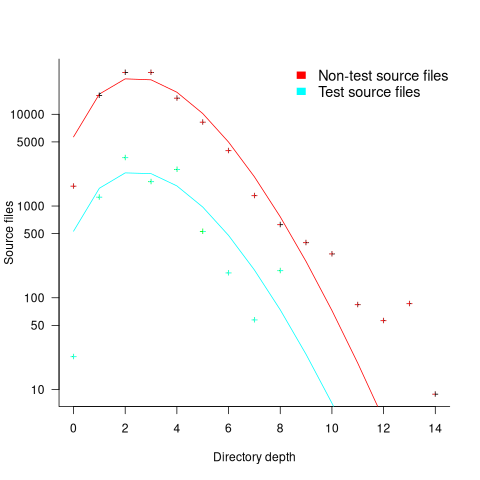
Studies of general file-systems found that number of files at a given subdirectory depth has a Poisson distribution with mean around 6.5. The mean depth for these C/C++ source files is 2.9.
Is this pattern of source file use specific to C/C++, or does it also occur in Java and Python? A question for another post.
Number of calls to/from functions vs function length
Depending on the language the largest unit of code is either a sequence of statements contained in a function/procedure/subroutine or a set of functions/methods contained in a larger unit, e.g., class/module/file. Connections between these largest units (e.g., calls to functions) provide a mechanism for analysing the structure of a program. These connections form a graph, and the structure is known as a call graph.
It is not always possible to build a completely accurate call graph by analysing a program’s source code (i.e., a static call graph) when the code makes use of function pointers. Uncertainty about which functions are called at certain points in the code is a problem for compiler writers wanting to do interprocedural flow analysis for code optimization, and static analysis tools looking for possible coding mistakes.
The following analysis investigates two patterns in the function call graph of C/C++ programs. While calls via function pointers can be very common at runtime, they are uncommon in the source. Function call information was extracted from 98 GitHub projects using CodeQL.
Functions that contain more code are likely to contain more function calls. The plot below shows lines of code against number of function calls for each of the 259,939 functions in whatever version of the Linux kernel is on GitHub today (25 Jan 2026), the red line is a regression fit showing  (the fit systematically deviates for larger functions {yet to find out why}; code and data):
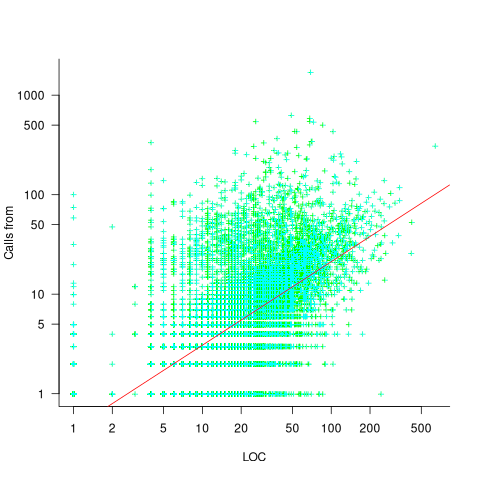
Researchers sometimes make a fuss of the fact that the number of calls per function is a power law, failing to note that this power law is a consequence of the number of lines per function being a power law (with an exponent of 2.8 for C, 2.7 for Java and 2.6 for Pharo). There are many small functions containing a few calls and a few large functions containing many calls.
Are more frequently called functions smaller (perhaps because they perform a simple operation that often needs to be done)? Widely used functionality is often placed in the same source file, and is usually called from functions in other files. The plot below shows the size of functions (in line of code) and the number of calls to them, for the 259,939 functions in the Linux kernel, with lines showing a LOESS fit to the corresponding points (code and data):
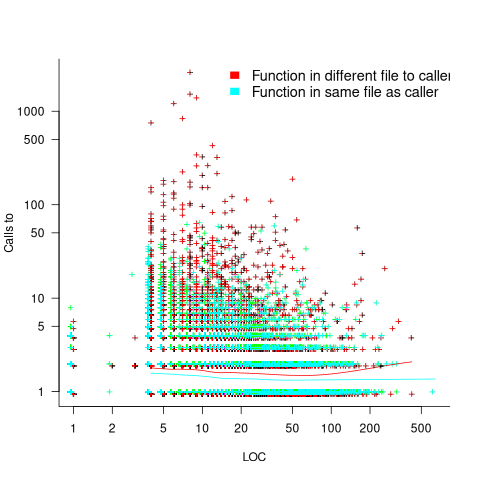
The apparent preponderance of red towards the upper left suggests that frequently called functions are short and contained in files different from the caller. However, the fitted LOESS lines show that the average difference is relatively small. There are many functions of a variety of sizes called once or twice, and few functions called very many times.
The program structure visible in a call graph is cluttered by lots of noise, such as calls to library functions, and the evolution baggage of previous structures. Also, a program may be built from source written in multiple languages (C/C++ is the classic example), and language interface issues can influence organization locally and globally (for instance, in Alibaba’s weex project the function main (in C) essentially just calls serverMain (in C++), which contains lots of code).
I suspect that many call graphs can be mapped to trees (the presence of recursion, though a chain of calls, sometimes comes as a surprise to developers working on a project). Call information needs to be integrated with loops and if-statements to figure out story structures (see section 6.9.1 of my C book). Don’t hold your breath for progress.
I expect that the above patterns are present in other languages. CodeQL supports multiple languages, but CodeQL source targeting one language has to be almost completely reworked to target another language, and it’s not always possible to extract exactly the same information. C/C++ appears have the best support.
Function calls are a component information
Recent Comments