Archive
Most percentages are more than half
Most developers think …
Most editors …
Most programs …
Linguistically most is a quantifier (it’s a proportional quantifier); a word-phrase used to convey information about the number of something, e.g., all, any, lots of, more than half, most, some.
Studies of most have often compared and contrasted it with the phrase more than half; findings include: most has an upper bound (i.e., not all), and more than half has a lower bound (but no upper bound).
A corpus analysis of most (432,830 occurrences) and more than half (4,857 occurrences) found noticeable usage differences. Perhaps the study’s most interesting finding, from a software engineering perspective, was that most tended to be applied to vague and uncountable domains (i.e., there was no expectation that the population of items could be counted), while uses of more than half almost always had a ‘survey results’ interpretation (e.g., supporting data cited as collaboration for 80% of occurrences; uses of most cited data for 19% of occurrences).
Readers will be familiar with software related claims containing the most qualifier, which are actually opinions that are not grounded in substantive numeric data.
When most is used in a numeric based context, what percentage (of a population) is considered to be most (of the population)?
When deciding how to describe a proportion, a writer has the choice of using more than half, most, or another qualifier. Corpus based studies find that the distribution of most has a higher average percentage value than more than half (both are left skewed, with most peaking around 80-85%).
When asked to decide whether a phrase using a qualifier is true/false, with respect to background information (e.g., Given that 55% of the birlers are enciad, is it true that: Most of the birlers are enciad?), do people treat most and more than half as being equivalent?
A study by Denić and Szymanik addressed this question. Subjects (200 took part, with results from 30 were excluded for various reasons) saw a statement involving a made-up object and verb, such as: “55% of the birlers are enciad.” They then saw a sentence containing either most or more than half, that was either upward-entailing (e.g., “More than half of the birlers are enciad.”), or downward-entailing (e.g., “It is not the case that more than half of the birlers are enciad.”); most/more than half and upward/downward entailing creates four possible kinds of sentence. Subjects were asked to respond true/false.
The percentage appearing in the first sentence of the two seen by subjects varied, e.g., “44% of the tiklets are hullaw.”, “12% of the puggles are entand.”, “68% of the plipers are sesare.” The percentage boundary where each subjects’ true/false answer switched was calculated (i.e., the mean of the percentages present in the questions’ each side of true/false boundary; often these values were 46% and 52%, whose average is 49; this is an artefact of the question wording).
The plot below shows the number of subjects whose true/false boundary occurred at a given percentage (code+data):
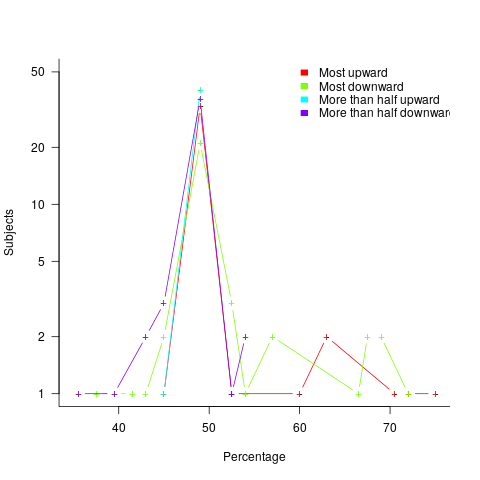
When asked, the majority of subjects had a 50% boundary for most/more than half+upward/downward. A downward entailment causes some subjects to lower their 50% boundary.
So now we know (subject to replication). Most people are likely to agree that 50% is the boundary for most/more than half, but some people think that the boundary percentage is higher for most.
When asked to write a sentence, percentages above 50% attract more mosts than more than halfs.
Most is preferred when discussing vague and uncountable domains; more than half is used when data is involved.
Update
The paper: Most quantifiers have many meanings by Ramotowska, Haaf, Van Maanen, and Szymanik analyses the five qualifiers: few, fewer than half, many, more than half, and most.
Over/under estimation factor for ‘most estimates’
When asked to estimate the time taken to perform a software development related task, people regularly over or under estimate. What range of over/under estimation falls within the bounds of the term ‘most estimates’, i.e., the upper/lower bounds of the ratio  (an overestimate occurs when
  , an underestimate when
  )?
)?
On Twitter, I have been citing a factor of two for over/under time estimates. This factor of two involves some assumptions and a personal interpretation.
The following analysis is based on the two major software task effort estimation datasets: SiP and CESAW. The tasks in both datasets are for internal projects (i.e., no tendering against competitors), and require at most a few hours work.
The following analysis is based on the SiP data.
Of the 8,252 unique tasks in the SiP data, 30% are underestimates, 37% exact, and 33% overestimates.
How do we go about calculating bounds for the over/under factor of most estimates (a previous post discussed calculating an accuracy metric over all estimates)?
A simplistic approach is to average over each of the overestimated and underestimated tasks. The plot below shows hours estimated against the ratio actual/estimated, for each task (code+data):
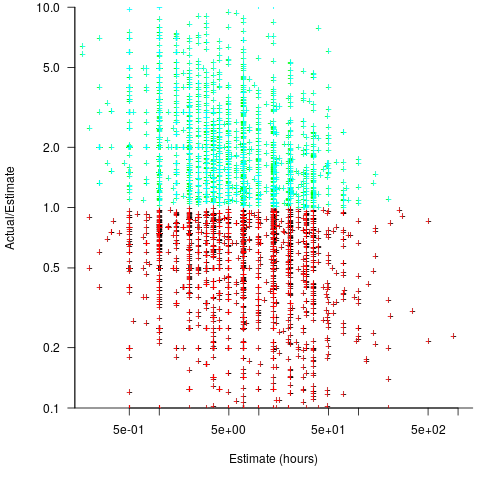
Averaging the over/under estimated tasks separately (using the geometric mean) gives 0.47 and 1.9 respectively, i.e., tasks are over/under estimated by a factor of two.
This approach fails to take into account the number of estimates that are over/under/equal, i.e., it ignores likelihood information.
A regression model takes into account the distribution of values, and we could adopt the fitted model’s prediction interval as the over/under confidence intervals. The prediction interval is the interval within which other observations are expected to fall, with some probability (R’s predict function uses one standard deviation).
The plot below shows a fitted regression model and prediction intervals at one standard deviation (68.3%) and two standard deviations (95%); the faint grey line shows Estimate == Actual (code+data):
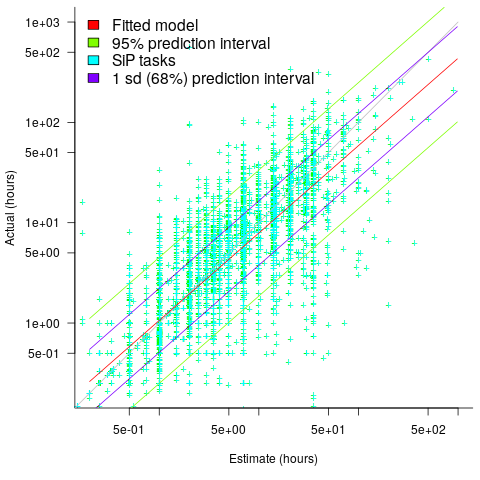
The fitted model tilts down from the upward direction of the Estimate == Actual line, consequently the over/under estimation factor depends on the size of the estimate. The table below lists the over/under estimation factor for low/high estimates at one & two standard deviations (68.3 and 95% probability).
People like simple answers (i.e., single values) and the mean value is a commonly used technique of summarising many values. The task estimate values are unevenly distributed and weighting the mean by the distribution of estimated values is more representative than, say, an evenly distributed set of estimates. The 5th and 6th columns in the table below list the weighted means at one/two standard deviations (the CESAW columns are the values for all projects in the CESAW data).
          1 sd           2 sd        Weighted mean       CESAW
       Low    High   Low    High     1 sd    2 sd     1 sd   2 sd
Over   0.56   0.24   0.27   0.11     0.46    0.25     0.29   0.1
Under 2.4 1.0 4.9 2.0 2.00 4.1 2.4 6.5 |
The weighted means for over/under estimates are close to a factor of two of the actual (divide/multiply) within one standard deviation (68.3%), and a factor of four within two standard deviations (95%).
Why choose to give the one standard deviation factor, rather than the two? People talk of “most estimates”, but what percentage range does ‘most’ map to? I have tended to think of ‘most’ as more than two-thirds, e.g., at least one standard deviation (a recent study suggests that ‘most’ usage peaks at 80-85%), and I think of two standard deviations as ‘nearly all’ (i.e., 95%; there are probably people who call this ‘most’).
Perhaps a between two and four is a more appropriate answer (particularly since the bounds are wider for the CESAW data). Suggestions welcome.
A Wikihouse hackathon
I was at the Wikihouse hackathon on Wednesday. Wikihouse is an open-source project involving prefabricated house designs and building processes.
Why is a software guy attending what looks like a very non-software event? The event organizers listed software developer as one of the attendee skill sets. Also, I have been following the blog Construction Physics, where Brian Potter has been trying to work out why the efficiency of building construction has not significantly improved over many decades; the approach is wide-ranging, data driven and has parallels with my analysis of software engineering. I counted four software people at the event, out of 30’ish attendees; Sidd I knew from previous hacks.
Building construction shares some characteristics with software development. In particular, projects are bespoke, but constructed using subcomponents that are variations on those used in most other projects of the same kind of building, e.g., walls±window frames, floors/ceilings.
The Wikihouse design and build process is based around a collection of standardised, prefabricated subcomponents, called blocks; these are made from plywood, slotted together, and held in place using butterfly/bow-tie joints (wood has a negative carbon footprint). A library of blocks is available, with the page for each block including a DXF cutting file, assembly manual, 3-D model, and costing; there is a design kit for building a house, including a spreadsheet for costing, and a variety of How-Tos. All this is available under an open source license. The Open Systems Lab is implementing building design software and turning planning codes into code.
Not knowing anything about building construction, I have no way of judging the claims made during the hackathon introductory presentations, e.g., cost savings, speed of build, strength of building, expected lifetime, etc.
Constructing lots of buildings using Wikihouse blocks could produce an interesting dataset (provided those doing the construction take the time to record things). Questions such as: how does construction time vary by team composition (self-build is possible) and experience, and by number of rooms and their size spring to mind (no construction time/team data was recorded during the construction of the ‘beta test’ buildings).
The morning was taken up with what was essentially a product pitch, then we got shown around the ‘beta test’ buildings (they feel bigger on the inside), lunch and finally a few hours hacking. The help they wanted from software people was in connecting together some of the data/tools they had created, but with only a few hours available there was little that could be done (my input was some suggestions on construction learning curves and a few people/groups I knew doing construction data analysis)
Will an open source approach enable the Wikihouse project to succeed with its prefabricated approach to building construction, where closed source companies have failed when using this approach, e.g., Katerra?
Part of the reason that open source software succeeded was that it provided good enough functionality to startup projects/companies who could not afford to pay for software (in some cases the open source tools provided superior functionality). Some of these companies grew to be significant players, convincing others that open source was viable for production work. Source code availability allows developers to use it without needing to involve management, and plenty of managers have been surprised to find out how embedded open source software is within their group/organization.
Buildings are not like software, lots of people with some kind of power notice when a new building appears. Buildings need to be connected to services such as water, gas and electricity, and they have a rateable value which the local council is keen to collect. Land is needed to build on, and there are a whole host of permissions and certificates that need to be obtained before starting to build and eventually moving in. Doing it, and telling people later is not an option, at least in the UK.
Cognitive effort, whatever it might be
Software developers spend a lot of time acquiring knowledge and understanding of the software system they are working on. This mental activity fits within the field of Cognition, which covers all aspects of intellectual functions and processes. Human cognition as it related to software development is covered in chapter 2 of my book Evidence-based software engineering; a reading list.
Cognitive effort (e.g., thinking) is hard work, or at least mental effort feels like hard work. It has become fashionable for those extolling the virtues of some development technique/process to claim that one of its benefits is a reduction in cognitive effort; sometimes the term cognitive load is used, but I suspect this is not a reference to cognitive load theory (which is working memory based).
A study by Arai, with herself as the subject, measured the time taken to mentally multiply two four-digit values (e.g., 2,645 times 5,784). Over 2-weeks, Arai practiced on four days, on each day multiplying over 20 four-digit value pairs. A week later Arai multiplied 40 four-digit value pairs (starting at 1:45pm, finishing at 6:31pm), had dinner between 6:31-7:41 pm, and then, multiplied 20 four-digit value pairs (starting at 7:41, finishing at 10:07). The plot below shows the time taken for each mental multiplication sequence, with fitted regression lines (code+data):
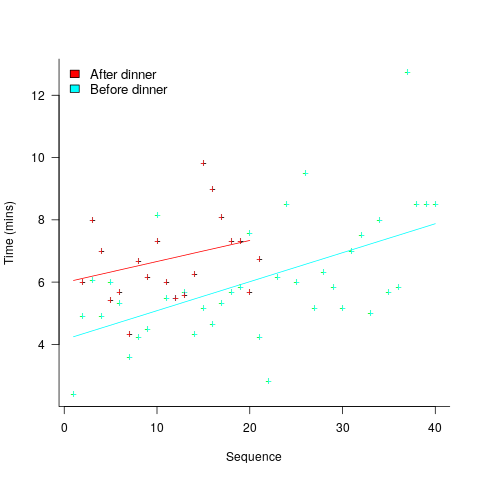
Over the course of the first, 5-hour session, average time taken slowed from four to eight minutes. The slope of the regression fit for the second session is poor, although the fit for the start value (6 minutes) is good.
The average increase in time taken is assumed to be driven by a reduction in mental effort, caused by the mental fatigue experienced during an extended period of continuous mental work.
What do we know about cognitive effort?
TL;DR Many theories and little evidence.
Cognitive psychologists are still at the stage of figuring out what exactly cognitive effort is. For instance, what is going on when we try harder (or decide to give up), and what is being conserved when we conserve our mental resources? The major theories include:
- Cognitive control: Mental processes form a continuum, from those that can be performed automatically with little or no effort, to those requiring concentrated conscious effort. Here, cognitive control is viewed as the force through which cognitive effort is exerted. The idea is that mental effort regulates the engagement of cognitive control in the same way as physical effort regulates the engagement of muscles.
- Metabolic constraints: Mental processes consume energy (glucose is the brain’s primary energy source), and the feeling of mental effort is caused by reduced levels of glucose. The extent to which mental effort is constrained by glucose levels is an ongoing debate.
- Capacity constraints: Working memory has a limited capacity (i.e., the oft quoted 7±2 limit), and tasks that fill this capacity do feel effortful. Cognitive load theory is based around this idea. A capacity limited working memory, as a basis of cognitive effort, suffers from the problem that people become mentally tired in the sense that later tasks feel like they require more effort. A capacity constrained model does not predict this behavior. Neither does a constraints model predict that increasing rewards can result in people exerting more cognitive effort.
How might cognitive effort be measured?
TL;DR It’s all relative or not at all.
To date, experiments have compared relative expenditure of effort between different tasks (some comparing cognitive with physical effort, other purely cognitive). For instance, showing that subjects are willing to perform a task requiring more cognitive effort when the expected reward is higher.
As always with human experiments, people can have very different behavioral characteristics. In particular, people differ in what is known as need for cognition, i.e., their willingness to invest cognitive effort.
While a lot of research has investigated the characteristics of working memory, the only real metric studied has been capacity, e.g., the longest sequence of digits that can be remembered/recalled, or span tasks involving having to remember words while performing simple arithmetic operations.
Experimental research on cognitive effort seems to be picking up, but don’t hold your breadth for reliable answers. Research of human characteristics can start out looking straight forward, but tends to quickly disappear down multiple, inconclusive rabbit holes.
Recent Comments