Evaluating estimation performance
What is the best way to evaluate the accuracy of an estimation technique, given that the actual values are known?
Estimates are often given as point values, and accuracy scoring functions (for a sequence of estimates) have the form }") , where
, where  is the number of estimated values,
  the estimates, and
  the actual values; smaller
  is better.
Commonly used scoring functions include:
=(E-A)^2") , known as squared error (SE)
, known as squared error (SE)=delim{|}{E-A}{|}") , known as absolute error (AE)
, known as absolute error (AE)=delim{|}{E-A}{|}/A") , known as absolute percentage error (APE)
, known as absolute percentage error (APE)=delim{|}{E-A}{|}/E") , known as relative error (RE)
, known as relative error (RE)
APE and RE are special cases of: =delim{|}{1-(A/E)^{beta}}{|}") , with
, with  and
and  respectively.
Let’s compare three techniques for estimating the time needed to implement some tasks, using these four functions.
Assume that the mean time taken to implement previous project tasks is known,  . When asked to implement a new task, an optimist might estimate 20% lower than the mean,
  , while a pessimist might estimate 20% higher than the mean,
  . Data shows that the distribution of the number of tasks taking a given amount of time to implement is skewed, looking something like one of the lines in the plot below (code):
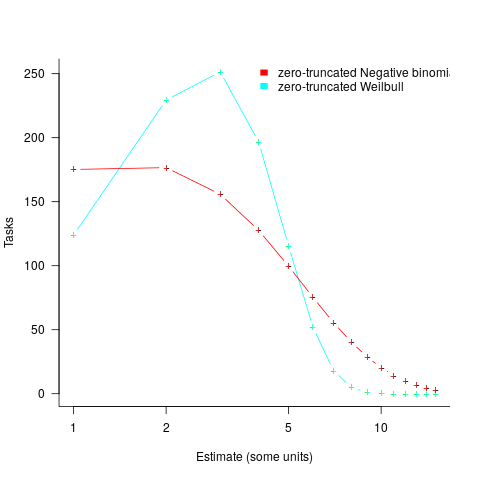
We can simulate task implementation time by randomly drawing values from a distribution having this shape, e.g., zero-truncated Negative binomial or zero-truncated Weibull. The values of  and
and  are calculated from the mean, , of the distribution used (see code for details). Below is each estimator’s score for each of the scoring functions (the best performing estimator for each scoring function in bold; 10,000 values were used to reduce small sample effects):
    SE   AE   APE   RE

  2.73 1.29 0.51 0.56

 2.31 1.23 0.39 0.68

  2.70 1.37 0.36 0.86
Surprisingly, the identity of the best performing estimator (i.e., optimist, mean, or pessimist) depends on the scoring function used. What is going on?
The analysis of scoring functions is very new. A 2010 paper by Gneiting showed that it does not make sense to select the scoring function after the estimates have been made (he uses the term forecasts). The scoring function needs to be known in advance, to allow an estimator to tune their responses to minimise the value that will be calculated to evaluate performance.
The mathematics involves Bregman functions (new to me), which provide a measure of distance between two points, where the points are interpreted as probability distributions.
Which, if any, of these scoring functions should be used to evaluate the accuracy of software estimates?
In software estimation, perhaps the two most commonly used scoring functions are APE and RE. If management selects one or the other as the scoring function to rate developer estimation performance, what estimation technique should employees use to deliver the best performance?
Assuming that information is available on the actual time taken to implement previous project tasks, then we can work out the distribution of actual times. Assuming this distribution does not change, we can calculate APE and RE for various estimation techniques; picking the technique that produces the lowest score.
Let’s assume that the distribution of actual times is zero-truncated Negative binomial in one project and zero-truncated Weibull in another (purely for convenience of analysis, reality is likely to be more complicated). Management has chosen either APE or RE as the scoring function, and it is now up to team members to decide the estimation technique they are going to use, with the aim of optimising their estimation performance evaluation.
A developer seeking to minimise the effort invested in estimating could specify the same value for every estimate. Knowing the scoring function (top row) and the distribution of actual implementation times (first column), the minimum effort developer would always give the estimate that is a multiple of the known mean actual times using the multiplier value listed:
                   APE   RE

Negative binomial  1.4   0.5

Weibull            1.2   0.6
For instance, management specifies APE, and previous task/actuals has a Weibull distribution, then always estimate the value  .
.
What mean multiplier should Esta Pert, an expert estimator aim for? Esta’s estimates can be modelled by the equation ") , i.e., the actual implementation time multiplied by a random value uniformly distributed between 0.5 and 2.0, i.e., Esta is an unbiased estimator. Esta’s table of multipliers is:
, i.e., the actual implementation time multiplied by a random value uniformly distributed between 0.5 and 2.0, i.e., Esta is an unbiased estimator. Esta’s table of multipliers is:
                   APE     RE

Negative binomial  1.0   0.7

Weibull                     1.0     0.7
A company wanting to win contracts by underbidding the competition could evaluate Esta’s performance using the RE scoring function (to motivate her to estimate low), or they could use APE and multiply her answers by some fraction.
In many cases, developers are biased estimators, i.e., individuals consistently either under or over estimate. How does an implicit bias (i.e., something a person does unconsciously) change the multiplier they should consciously aim for (having analysed their own performance to learn their personal percentage bias)?
The following table shows the impact of particular under and over estimate factors on multipliers:
                 0.8 underestimate bias   1.2 overestimate bias

Score function          APE   RE            APE   RE

Negative binomial        1.3   0.9           0.8   0.6

Weibull                 1.3       0.9           0.8   0.6
Let’s say that one-third of those on a team underestimate, one-third overestimate, and the rest show no bias. What scoring function should a company use to motivate the best overall team performance?
The following table shows that neither of the scoring functions motivate team members to aim for the actual value when the distribution is Negative binomial:
                    APE      RE

Negative binomial    1.1     0.7

Weibull                               1.0       0.7
One solution is to create a bespoke scoring function for this case. Both APE and RE are special cases of a more general scoring function (see top). Setting  in this general form creates a scoring function that produces a multiplication factor of 1 for the Negative binomial case.
Recent Comments