Archive
Software engineering research is a field of dots
Software engineering research is a field of dots; people are fully focused on publishing papers about their chosen tiny little subject.
Where are the books joining the dots into even a vague outline?
Several software researchers have told me that writing books is not a worthwhile investment of their time, i.e., the number of citations they are likely to attract makes writing papers the only cost-effective medium (books containing an edited collection of papers continue to be published).
Butterfly collecting has become the method of study for many researchers. The butterflies in question often being Github repos that are collected together, based on some ‘interestingness’ metric, and then compared and contrasted in a conference paper.
The dots being collected are influenced by the problems that granting agencies consider to be important topics to fund (picking a research problem that will attract funding is a major consideration for any researcher). Fake research is one consequence of incentivizing people to use particular techniques in their research.
Whatever you think the aims of research in software engineering might be, funding the random collecting of dots does not seem like an effective strategy.
Perhaps it is just a matter of waiting for the field to grow up. Evidence-based software engineering research is still a teenager, and the novelty of butterfly collecting has yet to wear off.
My study of particular kinds of dots did not reveal many higher level patterns, although a number of folk theories were shown to be unfounded.
Estimation experiments: specification wording is mostly irrelevant
Existing software effort estimation datasets provide information about estimates made within particular development environments and with particular aims. Experiments provide a mechanism for obtaining information about estimates made under conditions of the experimenters choice, at least in theory.
Writing the code is sometimes the least time-consuming part of implementing a requirement. At hackathons, my default estimate for almost any non-trivial requirement is a couple of hours, because my implementation strategy is to find the relevant library or package and write some glue code around it. In a heavily bureaucratic organization, the coding time might be a rounding error in the time taken up by meeting, documentation and testing; so a couple of months would be considered normal.
If we concentrate on the time taken to implement the requirements in code, then estimation time and implementation time will depend on prior experience. I know that I can implement a lexer for a programming language in half-a-day, because I have done it so many times before; other people take a lot longer because they have not had the amount of practice I have had on this one task. I’m sure there are lots of tasks that would take me many days, but there is somebody who can implement them in half-a-day (because they have had lots of practice).
Given the possibility of a large variation in actual implementation times, large variations in estimates should not be surprising. Does the possibility of large variability in subject responses mean that estimation experiments have little value?
I think that estimation experiments can provide interesting information, as long as we drop the pretence that the answers given by subjects have any causal connection to the wording that appears in the task specifications they are asked to estimate.
If we assume that none of the subjects is sufficiently expert in any of the experimental tasks specified to realistically give a plausible answer, then answers must be driven by non-specification issues, e.g., the answer the client wants to hear, a value that is defensible, a round number.
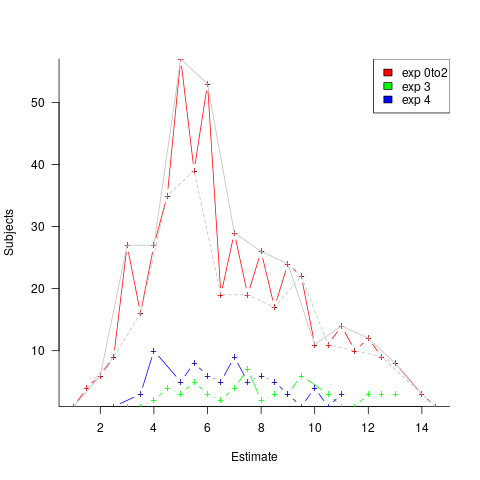
A study by Lucas Gren and Richard Berntsson Svensson asked subjects to estimate the total implementation time of a list of tasks. I usually ignore software engineering experiments that use student subjects (this study eventually included professional developers), but treating the experiment as one involving social processes, rather than technical software know-how, makes subject software experience a lot less relevant.
Assume, dear reader, that you took part in this experiment, saw a list of requirements that sounded plausible, and were then asked to estimate implementation time in weeks. What estimate would you give? I would have thrown my hands up in frustration and might have answered 0.1 weeks (i.e., a few hours). I expected the most common answer to be 4 weeks (the number of weeks in a month), but it turned out to be 5 (a very ‘attractive’ round number), for student subjects (code+data).
The professional subjects appeared to be from large organizations, who I assume are used to implementations including plenty of bureaucratic stuff, as well as coding. The task specification did not include enough detailed information to create an accurate estimate, so subjects either assumed their own work environment or played along with the fresh-faced, keen experimenter (sorry Lucas). The professionals showed greater agreement in that the range of value given was not as wide as students, but it had a more uniform distribution (with maximums, rather than peaks, at 4 and 7); see below. I suspect that answers at the high end were from managers and designers with minimal coding experience.
What did the experimenters choose weeks as the unit of estimation? Perhaps they thought this expressed a reasonable implementation time (it probably is if it’s not possible to use somebody else’s library/package). I think that they could have chosen day units and gotten essentially the same results (at least for student subjects). If they had chosen hours as the estimation unit, the spread of answers would have been wider, and I’m not sure whether to bet on 7 (hours in a working day) or 10 being the most common choice.
Fitting a regression model to the student data shows estimates increasing by 0.4 weeks per year of degree progression. I was initially baffled by this, and then I realized that more experienced students expect to be given tougher problems to solve, i.e., this increase is based on self-image (code+data).
The stated hypothesis investigated by the study involved none of the above. Rather, the intent was to measure the impact of obsolete requirements on estimates. Subjects were randomly divided into three groups, with each seeing and estimating one specification. One specification contained four tasks (A), one contained five tasks (B), and one contained the same tasks as (A) plus an additional task followed by the sentence: “Please note that R5 should NOT be implemented” (C).
A regression model shows that for students and professions the estimate for (A) is about 1-2 weeks lower than (B), while (A) estimates are 3-5 weeks lower than (C) estimated.
What are subjects to make of an experimental situation where the specification includes a task that they are explicitly told to ignore?
How would you react? My first thought was that the ignore R5 sentence was itself ignored, either accidentally or on purpose. But my main thought is that Relevance theory is a complicated subject, and we are a very long way away from applying it to estimation experiments containing supposedly redundant information.
The plot below shows the number of subjects making a given estimate, in days; exp0to2 were student subjects (dashed line joins estimate that include a half-hour value, solid line whole hour), exp3 MSc students, and exp4 professional developers (code+data):
I hope that the authors of this study run more experiments, ideally working on the assumption that there is no connection between specification and estimate (apart from trivial examples).
semgrep: the future of static analysis tools
When searching for a pattern that might be present in source code contained in multiple files, what is the best tool to use?
The obvious answer is grep, and grep is great for character-based pattern searches. But patterns that are token based, or include information on language semantics, fall outside grep‘s model of pattern recognition (which does not stop people trying to cobble something together, perhaps with the help of complicated sed scripts).
Those searching source code written in C have the luxury of being able to use Coccinelle, an industrial strength C language aware pattern matching tool. It is widely used by the Linux kernel maintainers and people researching complicated source code patterns.
Over the 15+ years that Coccinelle has been available, there has been a lot of talk about supporting other languages, but nothing ever materialized.
About six months ago, I noticed semgrep and thought it interesting enough to add to my list of tool bookmarks. Then, a few days ago, I read a brief blog post that was interesting enough for me to check out other posts at that site, and this one by Yoann Padioleau really caught my attention. Yoann worked on Coccinelle, and we had an interesting email exchange some 13-years ago, when I was analyzing if-statement usage, and had subsequently worked on various static analysis tools, and was now working on semgrep. Most static analysis tools are created by somebody spending a year or so working on the implementation, making all the usual mistakes, before abandoning it to go off and do other things. High quality tools come from people with experience, who have invested lots of time learning their trade.
The documentation contains lots of examples, and working on the assumption that things would be a lot like using Coccinelle, I jumped straight in.
The pattern I choose to search for, using semgrep, involved counting the number of clauses contained in Python if-statement conditionals, e.g., the condition in: if a==1 and b==2: contains two clauses (i.e., a==1, b==2). My interest in this usage comes from ideas about if-statement nesting depth and clause complexity. The intended use case of semgrep is security researchers checking for vulnerabilities in code, but I’m sure those developing it are happy for source code researchers to use it.
As always, I first tried building the source on the Github repo, (note: the Makefile expects a git clone install, not an unzipped directory), but got fed up with having to incrementally discover and install lots of dependencies (like Coccinelle, the code is written on OCaml {93k+ lines} and Python {13k+ lines}). I joined the unwashed masses and used pip install.
The pattern rules have a yaml structure, specifying the rule name, language(s), message to output when a match is found, and the pattern to search for.
After sorting out various finger problems, writing C rather than Python, and misunderstanding the semgrep output (some of which feels like internal developer output, rather than tool user developer output), I had a set of working patterns.
The following two patterns match if-statements containing a single clause (if.subexpr-1), and two clauses (if.subexpr-2). The option commutative_boolop is set to true to allow the matching process to treat Python’s or/and as commutative, which they are not, but it reduces the number of rules that need to be written to handle all the cases when ordering of these operators is not relevant (rules+test).
rules: - id: if.subexpr-1 languages: [python] message: if-cond1 patterns: - pattern: | if $COND1: # we found an if statement $BODY - pattern-not: | if $COND2 or $COND3: # must not contain more than one condition $BODY - pattern-not: | if $COND2 and $COND3: $BODY severity: INFO - id: if.subexpr-2 languages: [python] options: commutative_boolop: true # Reduce combinatorial explosion of rules message: if-cond2 pattern-either: - patterns: - pattern: | if $COND1 or $COND2: # if statement containing two conditions $BODY - pattern-not: | if $COND3 or $COND4 or $COND5: # must not contain more than two conditions $BODY - pattern-not: | if $COND3 or $COND4 and $COND5: $BODY - patterns: - pattern: | if $COND1 and $COND2: $BODY - pattern-not: | if $COND3 and $COND4 and $COND5: $BODY - pattern-not: | if $COND3 and $COND4 or $COND5: $BODY severity: INFO |
The rules would be simpler if it were possible for a pattern to not be applied to code that earlier matched another pattern (in my example, one containing more clauses). This functionality is supported by Coccinelle, and I’m sure it will eventually appear in semgrep.
This tool has lots of rough edges, and is still rapidly evolving, I’m using version 0.82, released four days ago. What’s exciting is the support for multiple languages (ten are listed, with experimental support for twelve more, and three in beta). Roughly what happens is that source code is mapped to an abstract syntax tree that is common to all supported languages, which is then pattern matched. Supporting a new language involves writing code to perform the mapping to this common AST.
It’s not too difficult to map different languages to a common AST that contains just tokens, e.g., identifiers and their spelling, literals and their value, and keywords. Many languages use the same operator precedence and associativity as C, plus their own extras, and they tend to share the same kinds of statements; however, declarations can be very diverse, which makes life difficult for supporting a generic AST.
An awful lot of useful things can be done with a tool that is aware of expression/statement syntax and matches at the token level. More refined semantic information (e.g., a variable’s type) can be added in later versions. The extent to which an investment is made to support the various subtleties of a particular language will depend on its economic importance to those involved in supporting semgrep (Return to Corp is a VC backed company).
Outside of a few languages that have established tools doing deep semantic analysis (i.e., C and C++), semgrep has the potential to become the go-to static analysis tool for source code. It will benefit from the network effects of contributions from lots of people each working in one or more languages, taking their semgrep skills and rules from one project to another (with source code language ceasing to be a major issue). Developers using niche languages with poor or no static analysis tool support will add semgrep support for their language because it will be the lowest cost path to accessing an industrial strength tool.
How are the VC backers going to make money from funding the semgrep team? The traditional financial exit for static analysis companies is selling to a much larger company. Why would a large company buy them, when they could just fork the code (other company sales have involved closed-source tools)? Perhaps those involved think they can make money by selling services (assuming semgrep becomes the go-to tool). I have a terrible track record for making business predictions, so I will stick to the technical stuff.
Update
Parts of the semgrep source have changed from an Open source license to a commercial one.
Opengrep is an Open source fork of semgrep.
Finding patterns in construction project drawing creation dates
I took part in Projecting Success‘s 13th hackathon last Thursday and Friday, at CodeNode (host to many weekend hackathons and meetups); around 200 people turned up for the first day. Team Designing-Success included Imogen, Ryan, Dillan, Mo, Zeshan (all building construction domain experts) and yours truly (a data analysis monkey who knows nothing about construction).
One of the challenges came with lots of real multi-million pound building construction project data (two csv files containing 60K+ rows and one containing 15K+ rows), provided by SISK. The data contained information on project construction drawings and RFIs (request for information) from 97 projects.
The construction industry is years ahead of the software industry in terms of collecting data, in that lots of companies actually collect data (for some, accumulate might be a better description) rather than not collecting/accumulating data. While they have data, they don’t seem to be making good use of it (so I am told).
Nearly all the discussions I have had with domain experts about the patterns found in their data have been iterative, brief email exchanges, sometimes running over many months. In this hack, everybody involved is sitting around the same table for two days, i.e., the conversation is happening in real-time and there is a cut-off time for delivery of results.
I got the impression that my fellow team-mates were new to this kind of data analysis, which is my usual experience when discussing patterns recently found in data. My standard approach is to start highlighting visual patterns present in the data (e.g., plot foo against bar), and hope that somebody says “That’s interesting” or suggests potentially more interesting items to plot.
After several dead-end iterations (i.e., plots that failed to invoke a “that’s interesting” response), drawings created per day against project duration (as a percentage of known duration) turned out to be of great interest to the domain experts.
Building construction uses a waterfall process; all the drawings (i.e., a kind of detailed requirements) are supposed to be created at the beginning of the project.
Hmm, many individual project drawing plots were showing quite a few drawings being created close to the end of the project. How could this be? It turns out that there are lots of different reasons for creating a drawing (74 reasons in the data), and that it is to be expected that some kinds of drawings are likely to be created late in the day, e.g., specific landscaping details. The 74 reasons were mapped to three drawing categories (As built, Construction, and Design Development), then project drawings were recounted and plotted in three colors (see below).
The domain experts (i.e., everybody except me) enjoyed themselves interpreting these plots. I nodded sagely, and occasionally blew my cover by asking about an acronym that everybody in the construction obviously knew.
The project meta-data includes a measure of project performance (a value between one and five, derived from profitability and other confidential values) and type of business contract (a value between one and four). The data from the 97 projects was combined by performance and contract to give 20 aggregated plots. The evolution of the number of drawings created per day might vary by contract, and the hypothesis was that projects at different performance levels would exhibit undesirable patterns in the evolution of the number of drawings created.
The plots below contain patterns in the quantity of drawings created by percentage of project completion, that are: (left) considered a good project for contract type 1 (level 5 are best performing projects), and (right) considered a bad project for contract type 1 (level 1 is the worst performing project). Contact the domain experts for details (code+data):
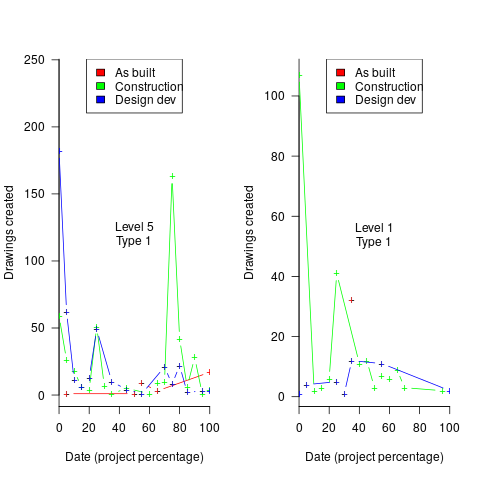
The path to the above plot is a common one: discover an interesting pattern in data, notice that something does not look right, use domain knowledge to refine the data analysis (e.g., kinds of drawing or contract), rinse and repeat.
My particular interest is using data to understand software engineering processes. How do these patterns in construction drawings compare with patterns in the software project equivalents, e.g., detailed requirements?
I am not aware of any detailed public data on requirements produced using a waterfall process. So the answer is, I don’t know; but the rationales I heard for the various kinds of drawings sound as-if they would have equivalents in the software requirements world.
What about the other data provided by the challenge sponsor?
I plotted various quantities for the RFI data, but there wasn’t any “that’s interesting” response from the domain experts. Perhaps the genius behind the plot ideas will be recognized later, or perhaps one of the domain experts will suddenly realize what patterns should be present in RFI data on high performance projects (nobody is allowed to consider the possibility that the data has no practical use). It can take time for the consequences of data analysis to sink in, or for new ideas to surface, which is why I am happy for analysis conversations to stretch out over time. Our presentation deck included some RFI plots because there was RFI data in the challenge.
What is the software equivalent of construction RFIs? Perhaps issues in a tracking system, or Jira tickets? I did not think to talk more about RFIs with the domain experts.
How did team Designing-Success do?
In most hackathons, the teams that stay the course present at the end of the hack. For these ProjectHacks, submission deadline is the following day; the judging is all done later, electronically, based on the submitted slide deck and video presentation. The end of this hack was something of an anti-climax.
Did team Designing-Success discover anything of practical use?
I think that finding patterns in the drawing data converted the domain experts from a theoretical to a practical understanding that it was possible to extract interesting patterns from construction data. They each said that they planned to attend the next hack (in about four months), and I suggested that they try to bring some of their own data.
Can these drawing creation patterns be used to help monitor project performance, as it progressed? The domain experts thought so. I suspect that the users of these patterns will be those not closely associated with a project (those close to a project are usually well aware of that fact that things are not going well).
Recent Comments