Archive
Apollo guidance computer software development process
MIT’s Draper Lab implemented the primary Guidance, Navigation and Control System (GNCS) for the Apollo spacecraft, i.e., the hardware+software (the source code is now available on GitHub). Project Apollo ran from 1961 to 1972, and many MIT project reports are available (the five volume set: “MIT’s Role in Project Apollo” probably contains more than you want to know).
What development processes were used to implement the Apollo GNCS software?
For decades, I was told that large organizations, such as NASA, used the Waterfall method to develop software. Did the implementation of the Apollo GNCS software use a Waterfall process?
Readers will be familiar with the wide gulf that can exist between documented management plans and what developers actually did (which is rarely documented). One technique for gaining insight into development practices is to follow the money. Implementation work is a cost, and a detailed cost breakdown timeline of the various development activities provides some insight into the work flow. Gold dust: Daniel Rankin’s 1972 Master’s thesis lists the Apollo project software development costs for each 6-month period from the start of 1962 until the end of 1970; it also gives the number of 16-bit words (the size of an instruction) contained in each binary release, along with the number of new instructions.
The GNCS computer contained 36,864 16-bit words of read-only memory and 2,048 words of read/write memory. The Apollo spacecraft contained two GNCS computers. The plot below shows the cumulative number of new code (in words) contained in all binary releases and the instructions contained in each binary release, with Apollo numbers at the release date of the code for that mission; grey lines show read only word limit and read-only plus twice read/write word limit (code+data):
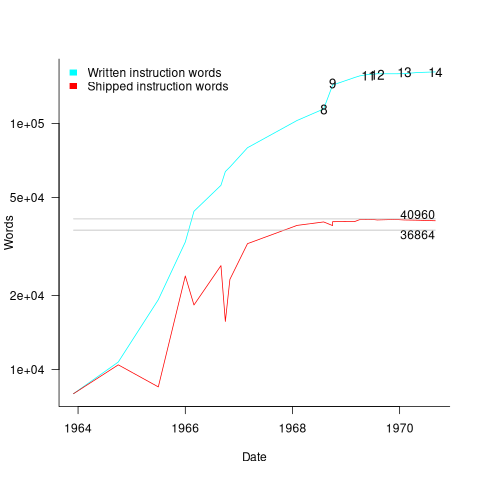
Four times as many instructions appeared over all releases, than made it into the final release. The continual turn-over of code in each release implies an iterative development process prior to the first manned launch, Apollo 8 (possibly an iterative waterfall process). After the first moon landing, Apollo 11, there were very few code changes for Apollo 12/13/14 (no data is available for the Apollo 15/16/17 missions).
The plot below shows thousands of dollars spent on the various software development activities within each 6-month period; the computing items are the cost of computer usage (code+data):
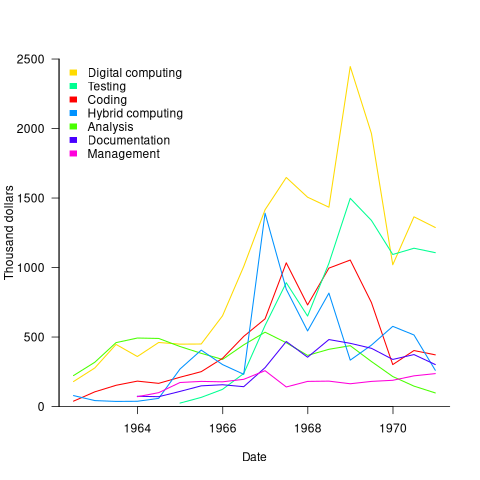
The plot suggests that most activities are ongoing over most of the decade. As expected, Coding costs significantly decrease before the release used during the first Moon landing, and testing costs continue at a high rate across the Apollo 11/12/13/14 missions. Why didn’t the Documentation costs go down when the Coding costs went down? Perhaps this was for some upcoming changes (not the Lunar rover which was built by Boeing). Activities in the legend are ordered by total amount spent; totals below:
Digital_Computer $18,373,000 Testing $ 9,786,000 Coding $ 8,233,000 Hybrid_Computer $ 7,190,000 Analysis $ 6,580,000 Documentation $ 4,177,000 Management $ 2,654,000 |
I think this data clearly shows that the Apollo GNCS software was developed using an iterative approach, and given that the cost of Coding was only twice as much as Documentation, within these iterations some form of Waterfall process was probably used.
Agile and Waterfall as community norms
While rapidly evolving computer hardware has been a topic of frequent public discussion since the first electronic computer, it has taken over 40 years for the issue of rapidly evolving customer requirements to become a frequent topic of public discussion (thanks to the Internet).
The following quote is from the Opening Address, by Andrew Booth, of the 1959 Working Conference on Automatic Programming of Digital Computers (published as the first “Annual Review in Automatic Programming”):
'Users do not know what they wish to do.' This is a profound truth. Anyone who has had the running of a computing machine, and, especially, the running of such a machine when machines were rare and computing time was of extreme value, will know, with exasperation, of the user who presents a likely problem and who, after a considerable time both of machine and of programmer, is presented with an answer. He then either has lost interest in the problem altogether, or alternatively has decided that he wants something else. |
Why did the issue of evolving customer requirements lurk in the shadows for so long?
Some of the reasons include:
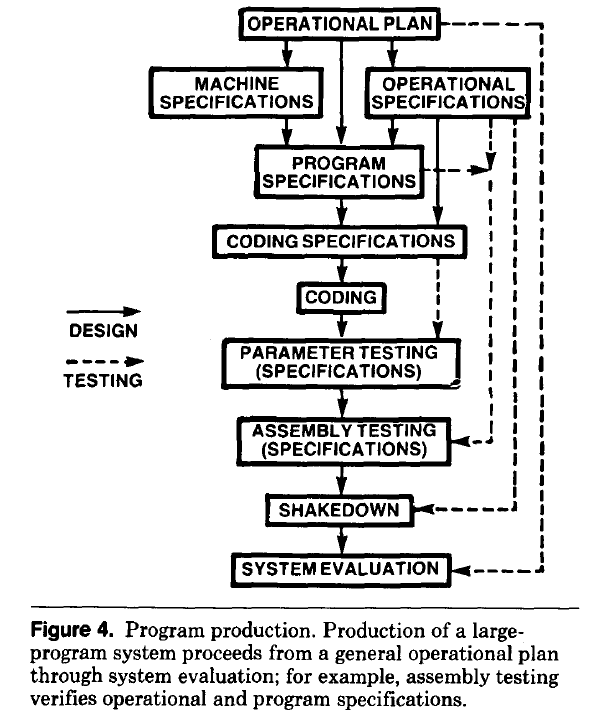
- established production techniques were applied to the process of building software systems. What is now known in software circles as the Waterfall model was/is an established technique. The figure below is from the 1956 paper Production of Large Computer Programs by Herbert Benington (Winston Royce’s 1970 paper has become known as the paper that introduced Waterfall, but the contents actually propose adding iterations to what Royce treats as an established process):
- management do not appreciate how quickly requirements can change (at least until they have experience of application development). In the 1980s, when microcomputers were first being adopted by businesses, I had many conversations with domain experts who were novice programmers building their first application for their business/customers. They were invariably surprised by the rate at which requirements changed, as development progressed.
While in public the issue lurked in the shadows, my experience is that projects claiming to be using Waterfall invariably had back-channel iterations, and requirements were traded, i.e., drop those and add these. Pre-Internet, any schedule involving more than two releases a year could be claimed to be making frequent releases.
Managers claimed to be using Waterfall because it was what everybody else did (yes, some used it because it was the most effective technique for their situation, and on some new projects it may still be the most effective technique).
Now that the issue of rapidly evolving requirements is out of the closet, what’s to stop Agile, in some form, being widely used when ‘rapidly evolving’ needs to be handled?
Discussion around Agile focuses on customers and developers, with middle management not getting much of a look-in. Companies using Agile don’t have many layers of management. Switching to Agile results in a lot of power shifting from middle management to development teams, in fact, these middle managers now look surplus to requirements. No manager is going to support switching to a development approach that makes them redundant.
Adam Yuret has another theory for why Agile won’t spread within enterprises. Making developers the arbiters of maximizing customer value prevents executives mandating new product features that further their own agenda, e.g., adding features that their boss likes, but have little customer demand.
The management incentives against using Agile in practice does not prevent claims being made about using Agile.
Now that Agile is what everybody claims to be using, managers who don’t want to stand out from the crowd find a way of being part of the community.
How did Agile become the product development zeitgeist?
From the earliest days of computing, people/groups have proposed software development techniques, and claiming them to be effective/productive ways of building software systems. Agile escaped this well of widely unknowns to become the dominant umbrella term for a variety of widely used software development methodologies (I’m talking about the term Agile, not any of the multitude of techniques claiming to be the true Agile way). How did this happen?
The Agile Manifesto was published in 2001, just as commercial use of the Internet was going through its exponential growth phase.
During the creation of a new market, as the Internet then was, there are no established companies filling the various product niches; being first to market provides an opportunity for a company to capture and maintain a dominate market share. Having a minimal viable product, for customers to use today, is critical.
In a fast-growing market, product functionality is likely to be fluid until good enough practices are figure out, i.e., there is a lack of established products whose functionality new entrants need to match or exceed.
The Agile Manifesto’s principles of early, continuous delivery, and welcoming of changing requirements are great strategic advice for building products in a new fast-growing market.
Now, I’m not saying that the early Internet based companies were following a heavy process driven approach, discovered Agile and switched to this new technique. No.
I’m claiming that the early Internet based companies were releasing whatever they had, with a few attracting enough customers to fund further product development. Based on customer feedback, or not, support was added for what were thought to be useful new features. If the new features kept/attracted customers, the evolution of the product could continue. Did these companies describe their development process as throw it at the wall and see what sticks? Claiming to be following sound practices, such as doing Agile, enables a company to appear to be in control of what they are doing.
The Internet did more than just provide a new market, it also provided a mechanism for near instantaneous zero cost product updates. The time/cost of burning thousands of CDs and shipping them to customers made continuous updates unrealistic, pre-Internet. Low volume shipments used to be made to important customers (when developing a code generator for a new computer, I sometimes used to receive OS updates on a tape, via the post-office).
The Agile zeitgeist comes from its association with many, mostly Internet related, successful software projects.
While an Agile process works well in some environments (e.g., when the development company can decide to update the software, because they run the servers), it can be problematic in others.
Agile processes are dependent on customer feedback, and making updates available via the Internet does not guarantee that customers will always install the latest version. Building software systems under contract, using an Agile process, only stands a chance of reaping any benefits when the customer is a partner in the same process, e.g., not using a Waterfall approach like the customer did in the Surrey police SIREN project.
Agile was in the right place at the right time.
Unneeded requirements implemented in Waterfall & Agile
Software does not wear out, but the world in which it runs evolves. Time and money is lost when, after implementing a feature in software, customer feedback is that the feature is not needed.
How do Waterfall and Agile implementation processes compare in the number of unneeded feature/requirements that they implement?
In a Waterfall process, a list of requirements is created and then implemented. The identity of ‘dead’ requirements is not known until customers start using the software, which is not until it is released at the end of development.
In an Agile process, a list of requirements is used to create a Minimal Viable Product, which is released to customers. An iterative development processes, driven by customer feedback, implements requirements, and makes frequent releases to customers, which reduces the likelihood of implementing known to be ‘dead’ requirements. Previously implemented requirements may be discovered to have become ‘dead’.
An analysis of the number of ‘dead’ requirements implemented by the two approaches appears at the end of this post.
The plot below shows the number of ‘dead’ requirements implemented in a project lasting a given number of working days (blue/red) and the difference between them (green), assuming that one requirement is implemented per working day, with the discovery after 100 working days that a given fraction of implemented requirements are not needed, and the number of requirements in the MVP is assumed to be small (fractions 0.5, 0.1, and 0.05 shown; code):
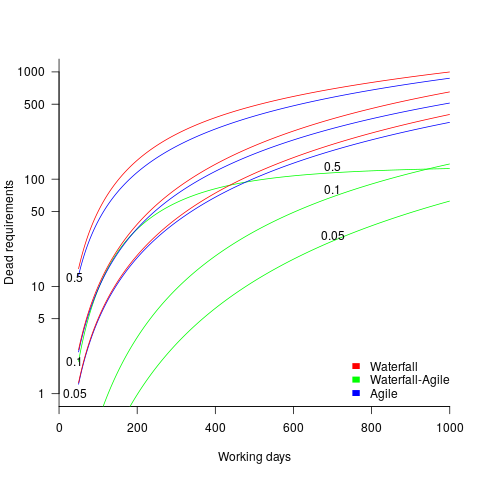
The values calculated using one requirement implemented per day scales linearly with requirements implemented per day.
By implementing fewer ‘dead’ requirements, an Agile project will finish earlier (assuming it only implements all the needed requirements of a Waterfall approach, and some subset of the ‘dead’ requirements). However, unless a project is long-running, or has a high requirements’ ‘death’ rate, the difference may not be compelling.
I’m not aware of any data on rate of discovery of ‘dead’ implemented requirements (there is some on rate of discovery of new requirements); as always, pointers to data most welcome.
The Waterfall projects I am familiar with, plus those where data is available, include some amount of requirement discovery during implementation. This has the potential to reduce the number of ‘dead’ implemented requirements, but who knows by how much.
As the size of Minimal Viable Product increases to become a significant fraction of the final software system, the number of fraction of ‘dead’ requirements will approach that of the Waterfall approach.
There are other factors that favor either Waterfall or Agile, which are left to be discussed in future posts.
The following is an analysis of Waterfall/Agile requirements’ implementation.
Define:
 is the fraction of requirements per day that remain relevant to customers. This value is likely to be very close to one, e.g.,
  .
.
 requirements implemented per working day.
Waterfall
The implementation of  requirements takes
  days, and the number of implemented ‘dead’ requirements is (assuming that the no ‘dead’ requirements were present at the end of the requirements gathering phase):
")
As  effectively all implemented requirements are ‘dead’.
Agile
The number of implemented ‘live’ requirements on day  is given by:

with the initial condition that the number of implemented requirements at the start of the first day of iterative development is the number of requirements implemented in the Minimum Viable Product, i.e.,  .
.
Solving this difference equation gives the number of ‘live’ requirements on day :
+F_{live}}")
as  ,
,  approaches to its maximum value of
Subtracting the number of ‘live’ requirements from the total number of requirements implemented gives:

or
+n*R_{done}(1-1/{n(1-F_{live})+F_{live}})")
or
+n*R_{done}{n-1}/{n+F_{live}/(1-F_{live})}")
as effectively all implemented requirements are ‘dead’, because the number of ‘live’ requirements cannot exceed a known maximum.
Update
The paper A software evolution experiment found that in a waterfall project, 40% of modules in the delivered system were not required.
Finding patterns in construction project drawing creation dates
I took part in Projecting Success‘s 13th hackathon last Thursday and Friday, at CodeNode (host to many weekend hackathons and meetups); around 200 people turned up for the first day. Team Designing-Success included Imogen, Ryan, Dillan, Mo, Zeshan (all building construction domain experts) and yours truly (a data analysis monkey who knows nothing about construction).
One of the challenges came with lots of real multi-million pound building construction project data (two csv files containing 60K+ rows and one containing 15K+ rows), provided by SISK. The data contained information on project construction drawings and RFIs (request for information) from 97 projects.
The construction industry is years ahead of the software industry in terms of collecting data, in that lots of companies actually collect data (for some, accumulate might be a better description) rather than not collecting/accumulating data. While they have data, they don’t seem to be making good use of it (so I am told).
Nearly all the discussions I have had with domain experts about the patterns found in their data have been iterative, brief email exchanges, sometimes running over many months. In this hack, everybody involved is sitting around the same table for two days, i.e., the conversation is happening in real-time and there is a cut-off time for delivery of results.
I got the impression that my fellow team-mates were new to this kind of data analysis, which is my usual experience when discussing patterns recently found in data. My standard approach is to start highlighting visual patterns present in the data (e.g., plot foo against bar), and hope that somebody says “That’s interesting” or suggests potentially more interesting items to plot.
After several dead-end iterations (i.e., plots that failed to invoke a “that’s interesting” response), drawings created per day against project duration (as a percentage of known duration) turned out to be of great interest to the domain experts.
Building construction uses a waterfall process; all the drawings (i.e., a kind of detailed requirements) are supposed to be created at the beginning of the project.
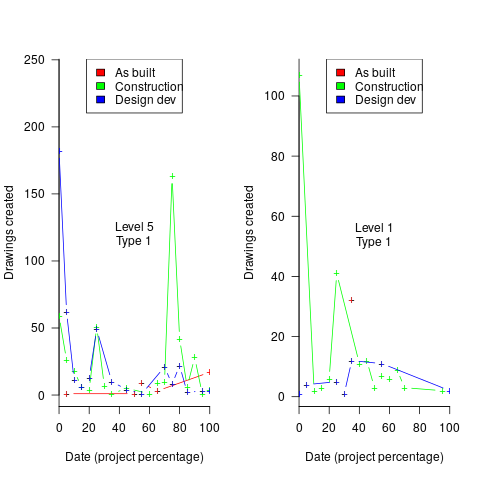
Hmm, many individual project drawing plots were showing quite a few drawings being created close to the end of the project. How could this be? It turns out that there are lots of different reasons for creating a drawing (74 reasons in the data), and that it is to be expected that some kinds of drawings are likely to be created late in the day, e.g., specific landscaping details. The 74 reasons were mapped to three drawing categories (As built, Construction, and Design Development), then project drawings were recounted and plotted in three colors (see below).
The domain experts (i.e., everybody except me) enjoyed themselves interpreting these plots. I nodded sagely, and occasionally blew my cover by asking about an acronym that everybody in the construction obviously knew.
The project meta-data includes a measure of project performance (a value between one and five, derived from profitability and other confidential values) and type of business contract (a value between one and four). The data from the 97 projects was combined by performance and contract to give 20 aggregated plots. The evolution of the number of drawings created per day might vary by contract, and the hypothesis was that projects at different performance levels would exhibit undesirable patterns in the evolution of the number of drawings created.
The plots below contain patterns in the quantity of drawings created by percentage of project completion, that are: (left) considered a good project for contract type 1 (level 5 are best performing projects), and (right) considered a bad project for contract type 1 (level 1 is the worst performing project). Contact the domain experts for details (code+data):
The path to the above plot is a common one: discover an interesting pattern in data, notice that something does not look right, use domain knowledge to refine the data analysis (e.g., kinds of drawing or contract), rinse and repeat.
My particular interest is using data to understand software engineering processes. How do these patterns in construction drawings compare with patterns in the software project equivalents, e.g., detailed requirements?
I am not aware of any detailed public data on requirements produced using a waterfall process. So the answer is, I don’t know; but the rationales I heard for the various kinds of drawings sound as-if they would have equivalents in the software requirements world.
What about the other data provided by the challenge sponsor?
I plotted various quantities for the RFI data, but there wasn’t any “that’s interesting” response from the domain experts. Perhaps the genius behind the plot ideas will be recognized later, or perhaps one of the domain experts will suddenly realize what patterns should be present in RFI data on high performance projects (nobody is allowed to consider the possibility that the data has no practical use). It can take time for the consequences of data analysis to sink in, or for new ideas to surface, which is why I am happy for analysis conversations to stretch out over time. Our presentation deck included some RFI plots because there was RFI data in the challenge.
What is the software equivalent of construction RFIs? Perhaps issues in a tracking system, or Jira tickets? I did not think to talk more about RFIs with the domain experts.
How did team Designing-Success do?
In most hackathons, the teams that stay the course present at the end of the hack. For these ProjectHacks, submission deadline is the following day; the judging is all done later, electronically, based on the submitted slide deck and video presentation. The end of this hack was something of an anti-climax.
Did team Designing-Success discover anything of practical use?
I think that finding patterns in the drawing data converted the domain experts from a theoretical to a practical understanding that it was possible to extract interesting patterns from construction data. They each said that they planned to attend the next hack (in about four months), and I suggested that they try to bring some of their own data.
Can these drawing creation patterns be used to help monitor project performance, as it progressed? The domain experts thought so. I suspect that the users of these patterns will be those not closely associated with a project (those close to a project are usually well aware of that fact that things are not going well).
Recent Comments