Archive
A safety-critical certification of the Linux kernel
This week there was an announcement on the system-safety mailing list that the Red Hat In-Vehicle Operating System (a version of the Linux kernel, plus a few subsystems) had been certified as being “… capable for use in ASIL B applications, …”. The Automotive Safety Integrity Levels (ASIL A is the lowest level, with D the highest; an example of ASIL B is controlling brake lights) are defined by ISO 26262, an international standard for functional safety of electrical and/or electronic systems installed in production road vehicles.
Given all I had heard about the problems that needed to be solved to get a safety certification for something as large and complicated as the Linux kernel, I wanted to know more about how Red Hat had achieved this certification.
The traditional, idealised, approach to certifying software is to check that all requirements are documented and traceable to the design, source code, tests, and test results. This information can be used to ensure that every requirement is implemented and produces the intended behavior, and that no undocumented functionality has been implemented.
When this approach is not practical (because of onerous time/cost), a potential get out of jail card is to use a Rigorous Development Process. Certification friendly development processes appear to revolve around lots of bureaucracy and following established buzzword techniques. The only development processes that have sometimes produced very reliable software all involve spending lots of time/money.
The major problems with certifying Linux are the apparent lack of specification/requirements documents, and a development process that does not claim to be rigorous.
The Red Hat approach is to treat the Linux man pages as the specification, extract the requirements from these pages, and then write the appropriate tests. Traceability looks like it is currently on the to-do list.
I have spent a lot of time working to understand specifications and their requirements; first with the C Standard and then with the Microsoft Server Protocols. This is the first time I have encountered man pages being used in a formal setting (sometimes they are used as one of the inputs to a reimplementation of a library).
Very little Open source software has a written specification in the traditional sense of a document cited in a contract that the vendor agrees to implement. Manuals, READMEs and help pages are not written in the formal style of a specification. A common refrain is that the source code is the specification. However, source is a specification of what the program does, it is not a specification of what the program is supposed to do.
The very nature of the Agile development process demands that there not be a complete specification. It’s possible that user stories could be treated as requirements.
There is an ISO Standard with Linux in its title: the Linux Base Standard. The goal of this Standard “… is to develop and promote a set of open standards that will increase compatibility among Linux distributions and enable software applications to run on any compliant system …”, i.e., it is not a specification of an OS kernel.
POSIX is a specification of the behavior of an OS (kernel functionality is specified by POSIX.1, .2 is shell and utilities, plus other .x documents). It’s many years since I tracked POSIX/Linux compliance, which was best described as “highly compatible”. Both Grok3 and ChatGPT o4 agree that “highly compatible” is still true, and list some known incompatibilities.
While they are not written in the form of a specification, the Linux man pages do have a consistent structure and are intended to be up-to-date. A person with a background of working with Linux kernels could probably extract meaningful requirements.
How many requirements are needed to cover the behavior of the Linux kernel?
On my computer running a 6.8.0-51 kernel, the /usr/include/linux directory contains 587 header files. Based on an analysis from 20 years ago (table 1897.1), most of these headers only declare macros and types (e.g., memory layout), not function declarations. The total number of function declarations in these headers is probably in the low thousands. POSIX (2008 version) defines 1,177 functions, but the number of system calls is probably around 300-400. Android implements 821 of these functions, of which 343 are system call related.
Let’s assume 2,000 functions. Some of these functions have an argument that specifies one or more optional values, each specifying a different sub-behavior. How many different sub-behaviors are there? If we assume that each kind of behavior is specified using a C macro, then Table 1897.1 suggests there might be around 10k C macros defined in these headers.
With positive/negative tests for each case, in round numbers we get (ignoring explicit testing of the values of struct members): *2 = 24,000") test files.
test files.
This calculation does not take into account combinations of options. I’m assuming that each test file will loop through various combinations of its kind of sub-behavior.
The 1990 C compiler validation suite contained around 1k tests. Thirty-five years later, 24k test files for a large OS feels low, but then combination testing should multiply the number of actual tests by at least an order of magnitude.
What is this hand-wavy analysis missing?
I suspect that the kernel is built with most of the optional functionality conditionally compiled out. This could significantly reduce the number of api functions and the supported options.
I have not taken into account any testing of the user-visible kernel data structures (because I don’t have any occurrence data).
Comments from readers with experience in testing OSes most welcome.
Another source of Linux specific information is the Linux Kernel documentation project. I don’t have any experience using this documentation, but the API documentation is very minimalist (automatically extracted from the source; the Assessment report lists this document as [D124], but never references it in the text).
Readers familiar with safety standards will be asking about the context in which this certification applies. Safety functions are not generic; they are specific to a safety-related system, i.e., software+hardware. This particular certification is for a Safety Element out of Context (SEooC), where “out of context” here means without the context of a system or knowledge of the safety goals. SEooC supports a bottom up approach to safety development, i.e., Safety Elements can be combined, along with the appropriate analysis and testing, to create a safety-related system.
This certification is the first of what I think will be many certifications of Linux, some at more rigorous safety levels.
C compiler conformance testing: with ChatGPT assistance
How can developers check that a compiler correctly implements all the behavior requirements contained in the corresponding language specification?
An obvious approach is to write lots of test cases for each distinct behavior; such a collection of tests is known as a validation suite, when used by a standard’s organization to test compilers/OS interfaces/etc. The extent to which a compiler’s behavior, when fed these tests, matches that listed in the language specification is a measure of its conformance.
In a world of many compilers with significant differences in behavior (i.e., pre-Open source), it makes economic sense for governments to sponsor the creation of validation suites, and/or companies to offer such suites commercially (mainly for C and C++). The spread of Open source compilers decimated compiler diversity, and compiler validation is fading into history.
New features continue to be added to Cobol, Fortran, C, and C++ by their respective ISO Standard’s committee. If governments are no longer funding updates to validation suites and the cost of commercial suites is too high for non-vendors (my experience is that compiler vendors find them to be cost-effective), how can developers check that a compiler conforms to the behavior specified by the Standard?
How much effort is required to create some minimal set of compiler conformance tests?
C is the language whose requirements I am most familiar with. The C Standard specifies that a conforming compiler issue a diagnostic for a violation of a requirement appearing in a Constraint clause, e.g., “For addition, either both operands shall have arithmetic type, or …”
There are 80 such clauses, containing around 530 non-blank lines, in N3301, the June 2024 draft. Let’s say 300+ distinct requirements, requiring a minimum of one test each. Somebody very familiar with the C Standard might take, say, 10 minutes per test, which is 3,000 minutes, or 50 hours, or 6.7 days; somebody slightly less familiar might take, say, at least an hour, which is 300+ hours, or 40+ days.
Lots of developers are using LLMs to generate source code from a description of what is needed. Given Constraint requirements in the C Standard, can an LLM generate tests that do a good enough job checking a compiler’s conformance to the C Standard?
Simply feeding the 157 pages from the Language chapter of the C Standard into an LLM, and asking it to generate tests for each Constraint requirement does not seem practical with the current state of the art; I’m happy to be proved wrong. A more focused approach might produce the desired tests.
Negative tests are likely to be the most challenging for an LLM to generate, because most publicly available source deals with positive cases, i.e., it is syntactically/semantically correct. The wording of Constraints sometimes specifies what usage is not permitted (e.g., clause 6.4.5.3 “A floating suffix df, dd, dl, DF, DD, or DL shall not be used in a hexadecimal floating literal.”), other times specifies what usage is permitted (e.g., clause 6.5.3.4 “The first operand of the . operator shall have an atomic, qualified, or unqualified structure or union type, and the second operand shall name a member of that type.”), or simply specifies a requirement (e.g., clause 6.7.3.2 “A member declaration that does not declare an anonymous structure or anonymous union shall contain a member declarator list.”).
I took the text from the 80 Constraint clauses, removed footnote numbers and rejoined words split at line-breaks. The plan was to prefix the text of each Constraint with instructions on the code requires. After some experimentation, the instructions I settled on were:
Write a sequence of very short programs which tests that a C compiler correctly flags each violation of the requirements contained in the following excerpt from the latest draft of the C Standard: |
Initially, excerpt was incorrectly spelled as except, but this did not seem to have any effect. Perhaps this misspelling is sufficiently common in the training data, that LLM weights support the intended association.
Experiments using Grok and ChatGPT 4o showed that both generated technically correct tests, but Grok generated code that was intended to be run (and was verbose), while the ChatGPT 4o output was brief and to the point; it did such a good job that I did not try any other LLMs. For this extended test, use of the web interface proved to be an effective approach. Interfacing via the API is probably more practical for larger numbers of requirements.
After some experimentation, I submitted the text from 31 Constraint clauses (I picked the non-trivial ones). The complete text of the questions and ChatGPT 4o responses (text files).
ChatGPT sometimes did not generate tests for all the requirements, when these were presented as they appeared in the Constraint, but did generate tests when the containing sentence was presented in isolation from other requirement sentences. For instance, the following sentence from clause 6.5.5 Cast Operators:
Conversions that involve pointers, other than where permitted by the constraints of 6.5.17.2, shall be specified by means of an explicit cast. |
was ignored when included as part of the complete Constraint, but when presented in isolation, reasonable tests were generated.
The responses never contained more than 10 test cases. I am guessing that this is the result of limits on response cpu time/length. Dividing the text of longer Constraints should solve this issue.
Some assumptions made by ChatGPT 4o about the implementation can be deduced from its responses, e.g., it appears to treat the type short as containing fewer than 32-bits (it assumes that a bit-field defined as a short containing 32-bits will be treated as a Constraint violation). This is not surprising, given the volume of public C source targeting the Intel x86.
I was impressed by the quality of the 242 test cases generated by ChatGPT 4o, which often included multiple tests for the same requirement (text files).
While it sometimes failed to produce a test for a requirement, I did not spot any incorrect tests (as in, not correctly testing for a violation of a listed requirement); the subset of tests feed through behaved as claimed), and I eventually found a prompt that appears to be creating a downloadable zip file of all the tests (most prompts resulted in a zip file containing some collection of 10 tests); the creation process is currently waiting for available cpu time. I now know that downloading a zip file containing one file per test, after each user prompt, is the more reliable option.
Agile and Waterfall as community norms
While rapidly evolving computer hardware has been a topic of frequent public discussion since the first electronic computer, it has taken over 40 years for the issue of rapidly evolving customer requirements to become a frequent topic of public discussion (thanks to the Internet).
The following quote is from the Opening Address, by Andrew Booth, of the 1959 Working Conference on Automatic Programming of Digital Computers (published as the first “Annual Review in Automatic Programming”):
'Users do not know what they wish to do.' This is a profound truth. Anyone who has had the running of a computing machine, and, especially, the running of such a machine when machines were rare and computing time was of extreme value, will know, with exasperation, of the user who presents a likely problem and who, after a considerable time both of machine and of programmer, is presented with an answer. He then either has lost interest in the problem altogether, or alternatively has decided that he wants something else. |
Why did the issue of evolving customer requirements lurk in the shadows for so long?
Some of the reasons include:
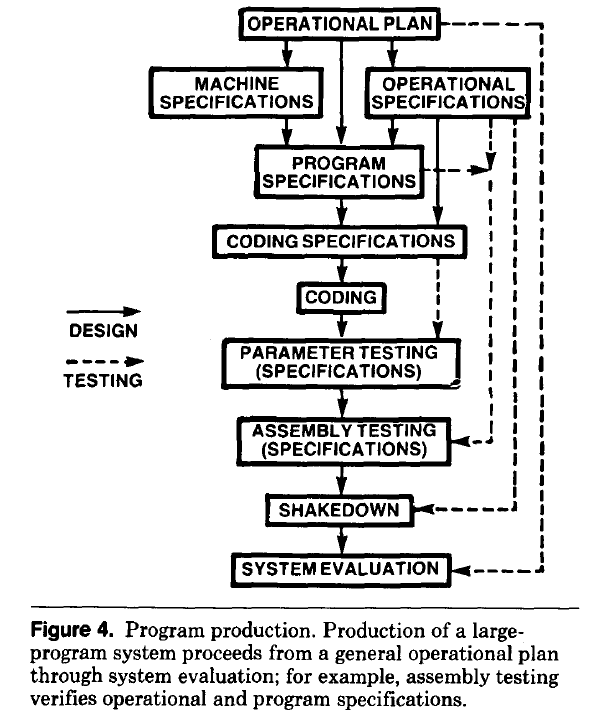
- established production techniques were applied to the process of building software systems. What is now known in software circles as the Waterfall model was/is an established technique. The figure below is from the 1956 paper Production of Large Computer Programs by Herbert Benington (Winston Royce’s 1970 paper has become known as the paper that introduced Waterfall, but the contents actually propose adding iterations to what Royce treats as an established process):
- management do not appreciate how quickly requirements can change (at least until they have experience of application development). In the 1980s, when microcomputers were first being adopted by businesses, I had many conversations with domain experts who were novice programmers building their first application for their business/customers. They were invariably surprised by the rate at which requirements changed, as development progressed.
While in public the issue lurked in the shadows, my experience is that projects claiming to be using Waterfall invariably had back-channel iterations, and requirements were traded, i.e., drop those and add these. Pre-Internet, any schedule involving more than two releases a year could be claimed to be making frequent releases.
Managers claimed to be using Waterfall because it was what everybody else did (yes, some used it because it was the most effective technique for their situation, and on some new projects it may still be the most effective technique).
Now that the issue of rapidly evolving requirements is out of the closet, what’s to stop Agile, in some form, being widely used when ‘rapidly evolving’ needs to be handled?
Discussion around Agile focuses on customers and developers, with middle management not getting much of a look-in. Companies using Agile don’t have many layers of management. Switching to Agile results in a lot of power shifting from middle management to development teams, in fact, these middle managers now look surplus to requirements. No manager is going to support switching to a development approach that makes them redundant.
Adam Yuret has another theory for why Agile won’t spread within enterprises. Making developers the arbiters of maximizing customer value prevents executives mandating new product features that further their own agenda, e.g., adding features that their boss likes, but have little customer demand.
The management incentives against using Agile in practice does not prevent claims being made about using Agile.
Now that Agile is what everybody claims to be using, managers who don’t want to stand out from the crowd find a way of being part of the community.
Unneeded requirements implemented in Waterfall & Agile
Software does not wear out, but the world in which it runs evolves. Time and money is lost when, after implementing a feature in software, customer feedback is that the feature is not needed.
How do Waterfall and Agile implementation processes compare in the number of unneeded feature/requirements that they implement?
In a Waterfall process, a list of requirements is created and then implemented. The identity of ‘dead’ requirements is not known until customers start using the software, which is not until it is released at the end of development.
In an Agile process, a list of requirements is used to create a Minimal Viable Product, which is released to customers. An iterative development processes, driven by customer feedback, implements requirements, and makes frequent releases to customers, which reduces the likelihood of implementing known to be ‘dead’ requirements. Previously implemented requirements may be discovered to have become ‘dead’.
An analysis of the number of ‘dead’ requirements implemented by the two approaches appears at the end of this post.
The plot below shows the number of ‘dead’ requirements implemented in a project lasting a given number of working days (blue/red) and the difference between them (green), assuming that one requirement is implemented per working day, with the discovery after 100 working days that a given fraction of implemented requirements are not needed, and the number of requirements in the MVP is assumed to be small (fractions 0.5, 0.1, and 0.05 shown; code):
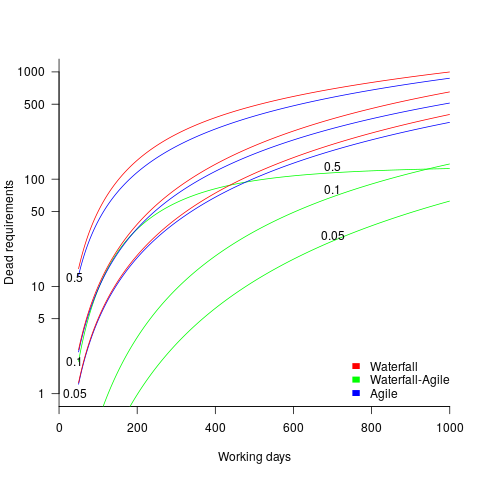
The values calculated using one requirement implemented per day scales linearly with requirements implemented per day.
By implementing fewer ‘dead’ requirements, an Agile project will finish earlier (assuming it only implements all the needed requirements of a Waterfall approach, and some subset of the ‘dead’ requirements). However, unless a project is long-running, or has a high requirements’ ‘death’ rate, the difference may not be compelling.
I’m not aware of any data on rate of discovery of ‘dead’ implemented requirements (there is some on rate of discovery of new requirements); as always, pointers to data most welcome.
The Waterfall projects I am familiar with, plus those where data is available, include some amount of requirement discovery during implementation. This has the potential to reduce the number of ‘dead’ implemented requirements, but who knows by how much.
As the size of Minimal Viable Product increases to become a significant fraction of the final software system, the number of fraction of ‘dead’ requirements will approach that of the Waterfall approach.
There are other factors that favor either Waterfall or Agile, which are left to be discussed in future posts.
The following is an analysis of Waterfall/Agile requirements’ implementation.
Define:
 is the fraction of requirements per day that remain relevant to customers. This value is likely to be very close to one, e.g.,
  .
.
 requirements implemented per working day.
Waterfall
The implementation of  requirements takes
  days, and the number of implemented ‘dead’ requirements is (assuming that the no ‘dead’ requirements were present at the end of the requirements gathering phase):
")
As  effectively all implemented requirements are ‘dead’.
Agile
The number of implemented ‘live’ requirements on day  is given by:

with the initial condition that the number of implemented requirements at the start of the first day of iterative development is the number of requirements implemented in the Minimum Viable Product, i.e.,  .
.
Solving this difference equation gives the number of ‘live’ requirements on day :
+F_{live}}")
as  ,
,  approaches to its maximum value of
Subtracting the number of ‘live’ requirements from the total number of requirements implemented gives:

or
+n*R_{done}(1-1/{n(1-F_{live})+F_{live}})")
or
+n*R_{done}{n-1}/{n+F_{live}/(1-F_{live})}")
as effectively all implemented requirements are ‘dead’, because the number of ‘live’ requirements cannot exceed a known maximum.
Update
The paper A software evolution experiment found that in a waterfall project, 40% of modules in the delivered system were not required.
Finding patterns in construction project drawing creation dates
I took part in Projecting Success‘s 13th hackathon last Thursday and Friday, at CodeNode (host to many weekend hackathons and meetups); around 200 people turned up for the first day. Team Designing-Success included Imogen, Ryan, Dillan, Mo, Zeshan (all building construction domain experts) and yours truly (a data analysis monkey who knows nothing about construction).
One of the challenges came with lots of real multi-million pound building construction project data (two csv files containing 60K+ rows and one containing 15K+ rows), provided by SISK. The data contained information on project construction drawings and RFIs (request for information) from 97 projects.
The construction industry is years ahead of the software industry in terms of collecting data, in that lots of companies actually collect data (for some, accumulate might be a better description) rather than not collecting/accumulating data. While they have data, they don’t seem to be making good use of it (so I am told).
Nearly all the discussions I have had with domain experts about the patterns found in their data have been iterative, brief email exchanges, sometimes running over many months. In this hack, everybody involved is sitting around the same table for two days, i.e., the conversation is happening in real-time and there is a cut-off time for delivery of results.
I got the impression that my fellow team-mates were new to this kind of data analysis, which is my usual experience when discussing patterns recently found in data. My standard approach is to start highlighting visual patterns present in the data (e.g., plot foo against bar), and hope that somebody says “That’s interesting” or suggests potentially more interesting items to plot.
After several dead-end iterations (i.e., plots that failed to invoke a “that’s interesting” response), drawings created per day against project duration (as a percentage of known duration) turned out to be of great interest to the domain experts.
Building construction uses a waterfall process; all the drawings (i.e., a kind of detailed requirements) are supposed to be created at the beginning of the project.
Hmm, many individual project drawing plots were showing quite a few drawings being created close to the end of the project. How could this be? It turns out that there are lots of different reasons for creating a drawing (74 reasons in the data), and that it is to be expected that some kinds of drawings are likely to be created late in the day, e.g., specific landscaping details. The 74 reasons were mapped to three drawing categories (As built, Construction, and Design Development), then project drawings were recounted and plotted in three colors (see below).
The domain experts (i.e., everybody except me) enjoyed themselves interpreting these plots. I nodded sagely, and occasionally blew my cover by asking about an acronym that everybody in the construction obviously knew.
The project meta-data includes a measure of project performance (a value between one and five, derived from profitability and other confidential values) and type of business contract (a value between one and four). The data from the 97 projects was combined by performance and contract to give 20 aggregated plots. The evolution of the number of drawings created per day might vary by contract, and the hypothesis was that projects at different performance levels would exhibit undesirable patterns in the evolution of the number of drawings created.
The plots below contain patterns in the quantity of drawings created by percentage of project completion, that are: (left) considered a good project for contract type 1 (level 5 are best performing projects), and (right) considered a bad project for contract type 1 (level 1 is the worst performing project). Contact the domain experts for details (code+data):
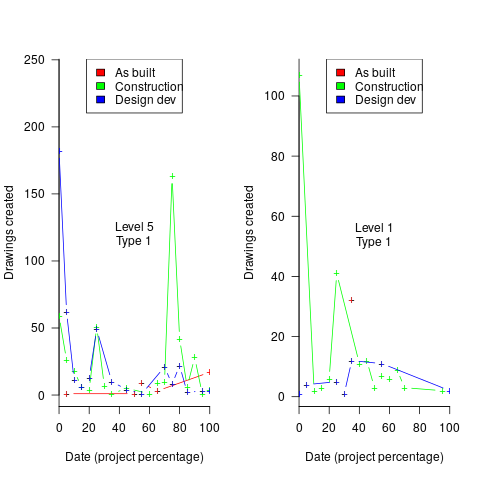
The path to the above plot is a common one: discover an interesting pattern in data, notice that something does not look right, use domain knowledge to refine the data analysis (e.g., kinds of drawing or contract), rinse and repeat.
My particular interest is using data to understand software engineering processes. How do these patterns in construction drawings compare with patterns in the software project equivalents, e.g., detailed requirements?
I am not aware of any detailed public data on requirements produced using a waterfall process. So the answer is, I don’t know; but the rationales I heard for the various kinds of drawings sound as-if they would have equivalents in the software requirements world.
What about the other data provided by the challenge sponsor?
I plotted various quantities for the RFI data, but there wasn’t any “that’s interesting” response from the domain experts. Perhaps the genius behind the plot ideas will be recognized later, or perhaps one of the domain experts will suddenly realize what patterns should be present in RFI data on high performance projects (nobody is allowed to consider the possibility that the data has no practical use). It can take time for the consequences of data analysis to sink in, or for new ideas to surface, which is why I am happy for analysis conversations to stretch out over time. Our presentation deck included some RFI plots because there was RFI data in the challenge.
What is the software equivalent of construction RFIs? Perhaps issues in a tracking system, or Jira tickets? I did not think to talk more about RFIs with the domain experts.
How did team Designing-Success do?
In most hackathons, the teams that stay the course present at the end of the hack. For these ProjectHacks, submission deadline is the following day; the judging is all done later, electronically, based on the submitted slide deck and video presentation. The end of this hack was something of an anti-climax.
Did team Designing-Success discover anything of practical use?
I think that finding patterns in the drawing data converted the domain experts from a theoretical to a practical understanding that it was possible to extract interesting patterns from construction data. They each said that they planned to attend the next hack (in about four months), and I suggested that they try to bring some of their own data.
Can these drawing creation patterns be used to help monitor project performance, as it progressed? The domain experts thought so. I suspect that the users of these patterns will be those not closely associated with a project (those close to a project are usually well aware of that fact that things are not going well).
Patterns of regular expression usage: duplicate regexs
Regular expressions are widely used, but until recently they were rarely studied empirically (i.e., just theory research).
This week I discovered two groups studying regular expression usage in source code. The VTSBULeeLab has various papers analysing 500K distinct regular expressions, from programs written in eight languages and StackOverflow; Carl Chapman and Peipei Wang have been looking at testing of regular expressions, and also ran an interesting experiment (I will write about this when I have decoded the data).
Regular expressions are interesting, in that their use is likely to be purely driven by an application requirement; the use of an integer literals may be driven by internal housekeeping requirements. The number of times the same regular expression appears in source code provides an insight (I claim) into the number of times different programs are having to solve the same application problem.
The data made available by the VTSBULeeLab group provides lots of information about each distinct regular expression, but not a count of occurrences in source. My email request for count data received a reply from James Davis within the hour 🙂
The plot below (code+data; crates.io has not been included because the number of regexs extracted is much smaller than the other repos) shows the number of unique patterns (y-axis) against the number of identical occurrences of each unique pattern (x-axis), e.g., far left shows number of distinct patterns that occurred once, then the number of distinct patterns that each occur twice, etc; colors show the repositories (language) from which the source was obtained (to extract the regexs), and lines are fitted regression models of the form:  , where:
  is driven by the total amount of source processed and the frequency of occurrence of regexs in source, and
  is the rate at which duplicates occur.
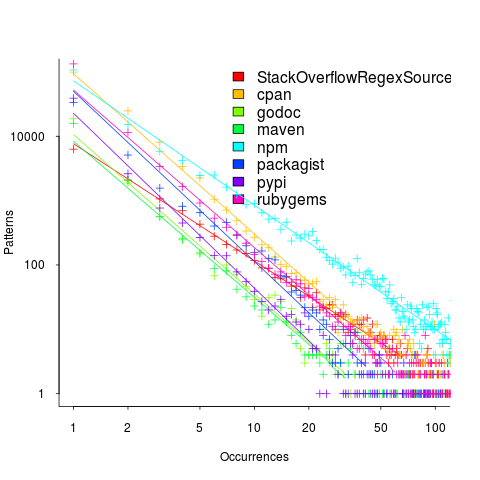
So most patterns occur once, and a few patterns occur lots of times (there is a long tail off to the unplotted right).
The following table shows values of for the various repositories (languages):
StackOverflow   cpan    godoc    maven    npm  packagist   pypi   rubygems
-1.8 -2.5 -2.5 -2.4 -1.9 -2.6 -2.7 -2.4 |
The lower (i.e., closer to zero) the value of , the more often the same regex will appear.
The values are in the region of -2.5, with two exceptions; why might StackOverflow and npm be different? I can imagine lots of duplicates on StackOverflow, but npm (I’m not really familiar with this package ecosystem).
I am pleased to see such good regression fits, and close power law exponents (I would have been happy with an exponential fit, or any other equation; I am interested in a consistent pattern across languages, not the pattern itself).
Some of the code is likely to be cloned, i.e., cut-and-pasted from a function in another package/program. Copy rates as high as 70% have been found. In this case, I don’t think cloned code matters. If a particular regex is needed, what difference does it make whether the code was cloned or written from scratch?
If the same regex appears in source because of the same application requirement, the number of reuses should be correlated across languages (unless different languages are being used to solve different kinds of problems). The plot below shows the correlation between number of occurrences of distinct regexs, for each pair of languages (or rather repos for particular languages; top left is StackOverflow).
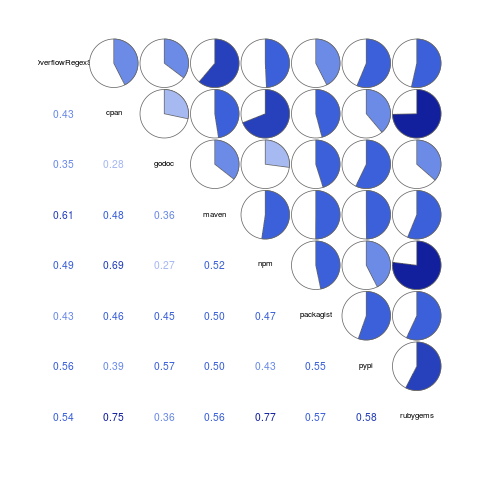
Why is there a mix of strong and weakly correlated pairs? Is it because similar application problems tend to be solved using different languages? Or perhaps there are different habits for cut-and-pasted source for developers using different repositories (which will cause some patterns to occur more often, but not others, and have an impact on correlation but not the regression fit).
There are a lot of other interesting things that can be done with this data, when connected to the results of the analysis of distinct regexs, but these look like hard work, and I have a book to finish.
Extracting absolute values from percentage data
Empirical data on requirements for commercial software systems is extremely hard to find. Massimo Felici’s PhD thesis on requirements evolution contains some very interesting data relating to an avionics system, but in many cases the graphs are plotted without numbers next to the axis tick marks. I imagine these numbers were removed because of concerns about what people who had been promoted beyond their level of competence might say (I would also have removed them if asked by the company who had provided the raw data, its a data providers market).
As soon as I saw the plot below I knew I could reverse engineer the original numbers for the plot in the top left.
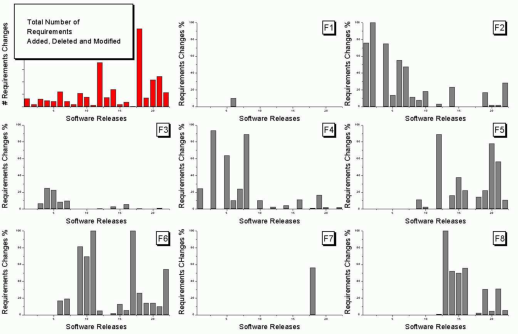
The top left plot is a total count of requirements added/deleted/modified in each of the 22 releases of the product. The eight other plots contain individual percentage information for each of the eight requirements features included in the total count product.
The key is that requirement counts have integer values and the percentages in the F1-8 plots are ratios that restrict the requirement counts to being exactly divisible by a calculated value.
I used WebPlotDigitizer, the goto tool for visually extracting data from plots, to obtain values for the height of each bar (for the time being assuming the unnumbered tick marks linearly increased in units of one).
Looking at the percentages for release one we see that 75% involved requirement feature F2 and 25% F4. This means that the total added/deleted/modified requirement count for release one must be divisible by 4. The percentages for release five are 64, 14 and 22; within a reasonable level of fuzziness this ratio is 9/2/3 and so the total count is probably divisible by 15. Repeating the process for release ten we get the ratio 7/4/1/28, probably divisible by 40; release six is probably divisible by 20, release nine by 10, release fourteen by 50 and fifteen by 10.
How do the release values extracted from the top left shape up when these divisibility requirements are enforced? A minimum value for the tick mark increment of 100 matches the divisibility requirements very well. Of course an increment of any multiple of 100 would match equally well, but until I spot a relationship that requires a larger value I will stick with 100.
I was not expecting to be so lucky in being able to extract useful ratios and briefly tried to be overly clever. Diophantine equations is the study of polynomial equations having integer solutions and there are lots of tools available for solving these equations. The data I have is fuzzy because it was extracted visually. A search for fuzzy diophantine equations locates some papers on how to solve such equations, but no obvious tools (there is code for solving fuzzy linear systems, but this technique does not restrict the solution space to integers).
The nearest possible solution path I could find involving statistics was: Statistical Analysis of Fuzzy Data.
If a reader has any suggestions for how to solve this problem automatically, given the percentage values, please let me know. Images+csvs for your delectation.
Recent Comments