Archive
Benchmarking desktop PCs circa 1990
Before buying a computer customers want to be confident of choosing the best they can get for the money, and performance has often been a major consideration. Computer benchmark performance results were once widely discussed.
Knight’s analysis of early mainframe performance was widely cited for many years.
Performance on the Byte benchmarks was widely cited before Intel started spending billions on advertising, clock frequency has not always had the brand recognition it has today.
The Byte benchmark was originally designed for Intel x86 processors running Microsoft DOS; The benchmark was introduced in the June 19885 issue, and was written in the still relatively new C language (earlier microprocessor benchmarks were often written in BASIC, because early micros often came with a free BASIC interpreter), it was updated in the 1990s to be Windows based, and implemented for Unix.
Benchmarking computers using essentially the same cpu architecture and operating system removes many complications that have to be addressed when these differ. Before Wintel wiped them out, computers from different manufacturers (and often the same manufacturer) contained completely different cpu architectures, ran different operating systems, and compilers were usually created in-house by the manufacturer (or some university who got a large discount on their computer purchase).
The Fall 1990 issue of Byte contains tables of benchmark results from 1988-90. What can we learn from these results?
The most important takeaway from the tables is that those performing the benchmarks appreciated the importance of measuring hardware performance using the applications that customers are likely to be running on their computer, e.g., word processors, spreadsheets, databases, scientific calculations (computers were still sufficiently niche back then that scientific users were a non-trivial percentage of the market), and compiling (hackers were a large percentage of Byte’s readership).
The C benchmarks attempted to measure CPU, FPU (built-in hardware support for floating-point arrived with the 486 in April 1989, prior to that it was an add-on chip that required spending more money), Disk and Video (at the time support for color was becoming mainstream, but bundled hardware graphics support still tended to be minimal).
Running the application benchmarks takes a lot of time, plus the necessary software (which takes time to install from floppies, the distribution technology of the day). Running the C benchmarks is much quicker and simpler.
Ideally the C benchmarks are a reliable stand-in for the application benchmarks (meaning that only the C benchmarks need be run).
Let’s fit some regression models to the measurements of the 61 systems benchmarked, all supporting hardware floating-point (code+data). Surprisingly there is no mention of such an exercise being done by the Byte staff, even though one of the scientific benchmarks included regression fitting.
The following fitted equations explain around 90% of the variance of the data, i.e., they are good fits.

For word-processing, the CPU benchmark explains around twice as much as the Disk benchmark.

For spreadsheets, CPU and Disk contribute about the same.

Database is nearly all Disk.
+0.45*CPU*Disk")
Scientific/Engineering is FPU, plus interactions with other components.
+0.33*Disk*Video")
Compiling is CPU, plus interactions with other components.
Byte’s benchmark reports were great eye candy, and readers probably took away a rough feel for the performance of various systems. Perhaps somebody at the time also fitted regression models to the data. The magazine contained plenty of adverts for software to do this.
Learning useful stuff from the Human cognition chapter of my book
What useful, practical things might professional software developers learn from the Human cognition chapter in my evidence-based software engineering book (an updated beta was release this week)?
Last week I checked the human cognition chapter; what useful things did I learn (combined with everything I learned during all the other weeks spent working on this chapter)?
I had spent a lot of time of learning about cognition when writing my C book; for this chapter I was catching up on what had happened in the last 10 years, which included: building executable models has become more popular, sample size has gotten larger (mostly thanks to Mechanical Turk), more researchers are making their data available on the web, and a few new theories (but mostly refinements of existing ideas).
Software is created by people, and it always seemed obvious to me that human cognition was a major topic in software engineering. But most researchers in computing departments joined the field because of their interest in maths, computers or software. The lack of interested in the human element means that the topic is rarely a research topic. There is a psychology of programming interest group, but most of those involved don’t appear to have read any psychology text books (I went to a couple of their annual workshops, and while writing the C book I was active on their mailing list for a few years).
What might readers learn from the chapter?
Visual processing: the rationale given for many code layout recommendations is plain daft; people need to learn something about how the brain processes images.
Models of reading. Existing readability claims are a joke (or bad marketing, take your pick). Researchers have been using eye trackers, since the 1960s, to figure out what actually happens when people read text, and various models have been built. Market researchers have been using eye trackers for decades to work out where best to place products on shelves, to maximise sales. In the last 10 years software researchers have started using eye trackers to study how people read code; next they need to learn about some of the existing models of how people read text. This chapter contains some handy discussion and references.
Learning and forgetting: it takes time to become proficient; going on a course is the start of the learning process, not the end.
One practical take away for readers of this chapter is being able to give good reasons how other people’s proposals, that are claimed to be based on how the brain operates, won’t work as claimed because that is not how the brain works. Actually, most of the time it is not possible to figure out whether something will work as advertised (this is why user interface testing is such a prolonged, and expensive, process), but the speaker with the most convincing techno-babble often wins the argument 🙂
Readers might have a completely different learning experience from reading the human cognition chapter. What useful things did you learn from the human cognition chapter?
Learning useful stuff from the Cognitive capitalism chapter of my book
What useful, practical things might professional software developers learn from the Cognitive capitalism chapter in my evidence-based software engineering book?
This week I checked the cognitive capitalism chapter; what useful things did I learn (combined with everything I learned during all the other weeks spent working on this chapter)?
Software systems are the product of cognitive capitalism (more commonly known as economics).
My experience is that most software developers don’t know anything about economics, so everything in this chapter is likely to be new to them. The chapter is more tutorial like than the other chapters.
Various investment models are discussed. The problem with these kinds of models is obtaining reliable data. But, hopefully the modelling ideas will prove useful.
Things I learned about when writing the chapter include: social learning, group learning, and Open source licensing is a mess.
Building software systems usually requires that many of the individuals involved to do lots of learning. How do people decide what to learn, e.g., copy others or strike out on their own? This problem is not software specific, in fact social learning appears to be one of the major cognitive abilities that separates us from other apes.
Organizational learning and forgetting is much talked about, and it was good to find some data dealing with this. Probably not applicable to most people.
Open source licensing is a mess in that software containing a variety of, possible incompatible, licenses often gets mixed together. What future lawsuits await?
For me, potentially the most immediately useful material was group learning; there are some interesting models for how this sometimes works.
Readers might have a completely different learning experience from reading the cognitive capitalism chapter. What useful things did you learn from the cognitive capitalism chapter?
Memory capacity growth: a major contributor to the success of computers
The growth in memory capacity is the unsung hero of the computer revolution. Intel’s multi-decade annual billion dollar marketing spend has ensured that cpu clock frequency dominates our attention (a lot of people don’t know that memory is available at different frequencies, and this can have a larger impact on performance that cpu frequency).
In many ways memory capacity is more important than clock frequency: a program won’t run unless enough memory is available but people can wait for a slow cpu.
The growth in memory capacity of customer computers changed the structure of the software business.
When memory capacity was limited by a 16-bit address space (i.e., 64k), commercially saleable applications could be created by one or two very capable developers working flat out for a year. There was no point hiring a large team, because the resulting application would be too large to run on a typical customer computer. Very large applications were written, but these were bespoke systems consisting of many small programs that ran one after the other.
Once the memory capacity of a typical customer computer started to regularly increase it became practical, and eventually necessary, to create and sell applications offering ever more functionality. A successful application written by one developer became rarer and rarer.
Microsoft Windows is the poster child application that grew in complexity as computer memory capacity grew. Microsoft’s MS-DOS had lots of potential competitors because it was small (it was created in an era when 64k was a lot of memory). In the 1990s the increasing memory capacity enabled Microsoft to create a moat around their products, by offering an increasingly wide variety of functionality that required a large team of developers to build and then support.
GCC’s rise to dominance was possible for the same reason as Microsoft Windows. In the late 1980s gcc was just another one-man compiler project, others could not make significant contributions because the resulting compiler would not run on a typical developer computer. Once memory capacity took off, it was possible for gcc to grow from the contributions of many, something that other one-man compilers could not do (without hiring lots of developers).
How fast did the memory capacity of computers owned by potential customers grow?
One source of information is the adverts in Byte (the magazine), lots of pdfs are available, and perhaps one day a student with some time will extract the information.
Wikipedia has plenty of articles detailing cpu performance, e.g., Macintosh models by cpu type (a comparison of Macintosh models does include memory capacity). The impact of Intel’s marketing dollars on the perception of computer systems is a PhD thesis waiting to be written.
The SPEC benchmarks have been around since 1988, recording system memory capacity since 1994, and SPEC make their detailed data public 🙂 Hardware vendors are more likely to submit SPEC results for their high-end systems, than their run-of-the-mill systems. However, if we are looking at rate of growth, rather than absolute memory capacity, the results may be representative of typical customer systems.
The plot below shows memory capacity against date of reported benchmarking (which I assume is close to the date a system first became available). The lines are fitted using quantile regression, with 95% of systems being above the lower line (i.e., these systems all have more memory than those below this line), and 50% are above the upper line (code+data):
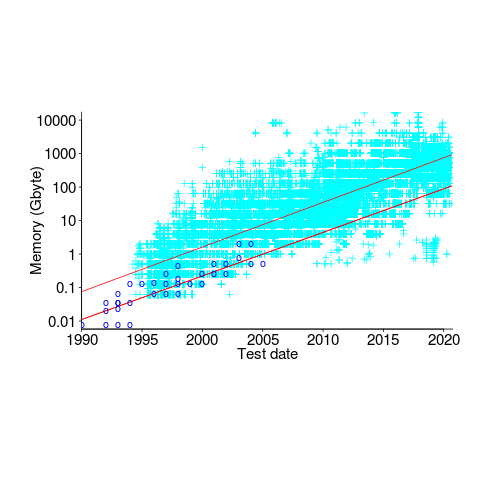
The fitted models show the memory capacity doubling every 845 or 825 days. The blue circles are memory that comes installed with various Macintosh systems, at time of launch (memory doubling time is 730 days).
How did applications’ minimum required memory grow over time? I have a patchy data for a smattering of products, extracted from Wikipedia. Some vendors probably required customers to have a fairly beefy machine, while others went for a wider customer base. Data on the memory requirements of the various versions of products launched in the 1990s is very hard to find. Pointers very welcome.
Recent Comments