Archive
Increase in defect fixing costs with distance from original mistake
During software development, when a mistake has been made it may be corrected soon after it is made, much later during development, by the customer in a shipped product, or never corrected.
If a mistake is corrected, the cost of correction increases as the ‘distance’ between its creation and detection increases. In a phased development model, the distance might be the number of phases between creation and detection; in a throw it at the wall and see if it sticks development model, the distance might be the number of dependencies on the ‘mistake’ code.
There are people who claim that detecting mistakes earlier will save money. This claim overlooks the cost of detecting mistakes, and in some cases earlier detection is likely to be more expensive (or the distribution of people across phases may rate limit what can be done in any phase). For instance, people might not be willing to read requirements documents, but be willing to try running software; some coding mistakes are only going to be encountered later during integration test, etc.
Folklore claims of orders of magnitude increases in fixing cost, as ‘distance’ increases, have been shown to be hand waving.
I know of two datasets on ‘distance’ between mistake creation and detection. A tiny dataset in Implementation of Fault Slip Through in Design Phase of the Project (containing only counts information; also see figure 6.41), and the CESAW dataset.
The plot below shows the time taken to fix 7,000 reported defects by distance between phases, for CESAW project 615 (code+data). The red lines are fitted regression models of the form  , for minimum fix times of 1, 5 and 10 minutes:
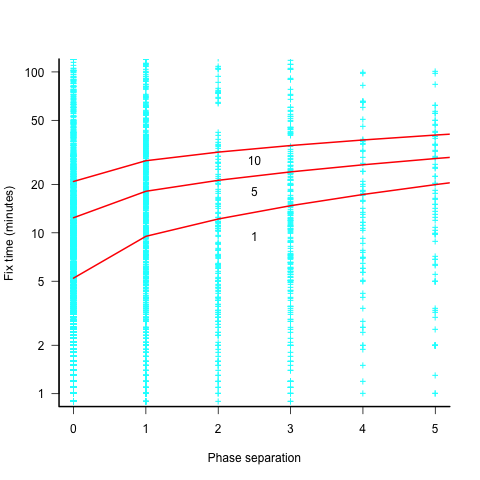
The above plot makes various simplifying assumptions, including: ‘sub-phases’ being associated with a ‘parent’ phase selected by your author, and the distance between all pairs of adjacent phase is the same (in terms of their impact on fix time).
A more sophisticated data model might change the functional form of the fitted regression model, but is unlikely to remove the general upward trend.
There are lots of fix times taking less than five minutes. Project 615 developed safety critical software, and so every detected mistake was recorded; on other projects, small mistakes would probably been fixed without an associated formal record.
I think that, if it were not for the, now discredited, folklore claiming outsized relative costs for fixing reported defects at greater ‘distances’ from the introduction of a mistake, this issue would be a niche topic.
Evidence-based book: six months of downloads
When my C book was first made available as a freely downloadable pdf, in 2005, there were between 19k to 37k downloads in the first week. The monthly download rate remained stable at around 1k per month for several years, and now floats around 100 per month.
I was hoping to have many more downloads for my Evidence-based software engineering book. The pdf became available last year on November 8th, and there were around 10k downloads in the first week. Then a link to my blog post announcing the availability of the book was posted to news.ycombinator. That generated quarter million downloads of the pdf, with an end-of-month figure of 275,309 plus 16,135 for the mobile friendly version.
The initial release did not include a mobile friendly version. After a half-a-dozen or so requests in various forums, I quickly worked up a mobile friendly pdf (i.e., the line length was reduced to be visually readable on a mobile phone, or at least on my 7-year-old phone which is smaller than most).
In May a link to the book’s webpage was posted on news.ycombinator. This generated 125k+ downloads, and the top-rated comment was that this was effectively a duplicate of the November post.
The plot below shows the number of pdf downloads for A4 and mobile formats, along with the number of kilo-bytes downloaded, for the 6-months since the initial release (code+data):
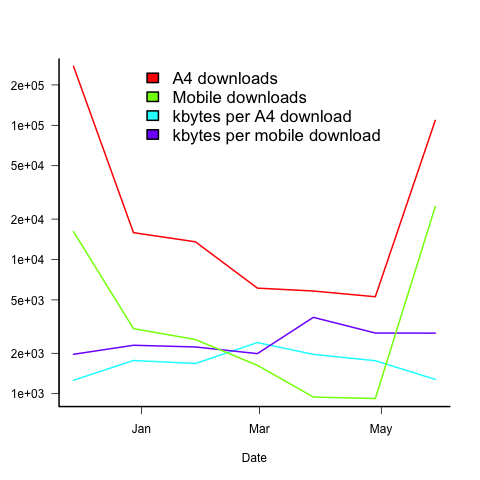
On average, there are five A4 downloads per mobile download (excluding November because of the later arrival of a mobile friendly version).
A download is rarely a complete copy (which is 23Mbyte), with the 6-month average being 1.7M for A4 and 2.5M for mobile. I have no idea of the reason for this difference.
The bytes per download is lower in the months when the ycombinator activity occurred. Is this because the ycombinator crowd tend to skim content (based on some of the comments, I suspect that many comments never read further than the cover)?
Copies of the pdf were made available on other sites, but based on the data I have seen, the downloads were not more than a few thousand.
I have not had any traffic spikes caused by non-English language interest. The C book experienced a ‘China’ spike, and I emailed the author of the blog post that caused it, to notify him of the Evidence-based book; he kindly posted an article on the book, but this did not generate a noticeable spike.
I’m confident that eventually a person in China/Russia/India/etc, with tens of thousands of followers, will post a link and there will be a noticeable download spike from that region.
What was the impact of content delivery networks and ISP caching? I have no idea. Pointers to write-ups on the topic welcome.
The CESAW dataset: a brief introduction
I have found that the secret for discovering data treasure troves is persistently following any leads that appear. For instance, if a researcher publishes a data driven paper, then check all their other papers. The paper: Composing Effective Software Security Assurance Workflows contains a lot of graphs and tables, but no links to data, however, one of the authors (William R. Nichols) published The Cost and Benefits of Static Analysis During Development which links to an amazing treasure trove of project data.
My first encounter with this data was this time last year, as I was focusing on completing my Evidence-based software engineering book. Apart from a few brief exchanges with Bill Nichols the technical lead member of the team who obtained and originally analysed the data, I did not have time for any detailed analysis. Bill was also busy, and we agreed to wait until the end of the year. Bill’s and my paper: The CESAW dataset: a conversation is now out, and focuses on an analysis of the 61,817 task and 203,621 time facts recorded for the 45 projects in the CESAW dataset.
Our paper is really an introduction to the CESAW dataset; I’m sure there is a lot more to be discovered. Some of the interesting characteristics of the CESAW dataset include:
- it is the largest publicly available project dataset currently available, with six times as many tasks as the next largest, the SiP dataset. The CESAW dataset involves the kind of data that is usually encountered, i.e., one off project data. The SiP dataset involves the long term evolution of one company’s 20 projects over 10-years,
- it includes a lot of information I have not seen elsewhere, such as: task interruption time and task stop/start {date/time}s (e.g., waiting on some dependency to become available)
- four of the largest projects involve safety critical software, for a total of 28,899 tasks (this probably more than two orders of magnitude more than what currently exists). Given all the claims made about the development about safety critical software being different from other kinds of development, here is a resource for checking some of the claims,
- the tasks to be done, to implement a project, are organized using a work-breakdown structure. WBS is not software specific, and the US Department of Defense require it to be used across all projects; see MIL-STD-881. I will probably annoy those in software management by suggesting the one line definition of WBS as: Agile+structure (WBS supports iteration). This was my first time analyzing WBS project data, and never having used it myself, I was not really sure how to approach the analysis. Hopefully somebody familiar with WBS will extract useful patterns from the data,
- while software inspections are frequently talked about, public data involving them is rarely available. The WBS process has inspections coming out of its ears, and for some projects inspections of one kind or another represent the majority of tasks,
- data on the kinds of tasks that are rarely seen in public data, e.g., testing, documentation, and design,
- the 1,324 defect-facts include information on: the phase where the mistake was made, the phase where it was discovered, and the time taken to fix.
As you can see, there is lots of interesting project data, and I look forward to reading about what people do with it.
Once you have downloaded the data, there are two other sources of information about its structure and contents: the code+data used to produce the plots in the paper (plus my fishing expedition code), and a CESAW channel on the Evidence-based software engineering Slack channel (no guarantees about response time).
Impact of native language on variable naming
When creating a variable name, to what extent are developers influenced by their native human language?
There is lots of evidence that variable names are either English words, abbreviations of English words, or some combination of these two. Source code containing a large percentage of identifiers using words from other languages does exist, but it requires effort to find; there is a widely expressed view that source should be English based (based on my experience of talking to non-native English speakers, and even the odd paper discussing the issue, e.g., Language matters).
Given that variable names can prove information that reduces the effort needed to understand code, and that most code is only ever read by the person who wrote it, developers should make the most of their expertise in using their native language.
To what extent do non-native English-speaking developers make use of their non-English native language?
I have found it very difficult to even have a discussion around this question. When I broach the subject with non-native English speakers, the response is often along the lines of “our develo0pers speak good English.” I am careful to set the scene by telling them of my interest in naming, and that I think there are benefits for developers to make use of their native language. The use of non-English languages in software development is not yet a subject that is open for discussion.
I knew that sooner or later somebody would run an experiment…
How Developers Choose Names is another interesting experiment involving Dror Feitelson (the paper rather confusingly refers to it as a survey, a post on an earlier experiment).
What makes this experiment interesting is that bilingual subjects (English and Hebrew) were used, and the questions were in English or Hebrew. The 230 subjects (some professional, some student) were given a short description and asked to provide an appropriate variable/function/data-structure name; English was used for 26 of the question, and Hebrew for the other 21 questions, and subjects answered a random subset.
What patterns of Hebrew usage are present in the variable names?
Out of 2017 answers, 14 contained Hebrew characters, i.e., not enough for statistical analysis. This does not mean that all the other variable names were only derived from English words, in some cases Hebrew words appeared via transcription using the 26 English letters. For instance, using “pinuk” for the Hebrew word that means “benefit” in English. Some variables were created from a mixture of Hebrew and English words, e.g., deservedPinuks and pinuksUsed.
Analysing this data requires someone who is fluent in Hebrew and English. I am not a fluent, or even non-fluent, Hebrew speaker. My role in this debate is encouraging others, and at last I have some interesting data to show people.
The paper spends time showing how for personal preferences result in a wide selection of names being chosen by different people for the same quantity. I cannot think of any software engineering papers that have addressed this issue for variable names, but there is lots of evidence from other fields; also see figure 7.33.
Those interested in searching source code for the impact of native-language might like to look at the names of variables appearing as operands of the bitwise and logical operators. Some English words occur much more frequently in the names of these variable, compared to variables that are operands of arithmetic operators, e.g., flag, status, and signal. I predict that non-native English-speaking developers will make use of corresponding non-English words.
Recent Comments