Archive
Rounding in reported task implementation time
There is lots of evidence that people often pick a round number when estimating the time needed to implement a task. Parkinson’s law suggests that reported actual implementation time will often also be a round number, e.g., report 30 minutes for a task that actually took 28 minutes.
If a task is estimated to take 1-hour, what is the distribution of reported implementations times? The analysis in this article uses the SiP task dataset, and similar patterns occur in other datasets.
The plot below shows the number of tasks having a given reported implementation time, for tasks estimated to take 1-hour, with main peaks labelled in red (reported times rounded to one decimal place and quarter hours; code+data):
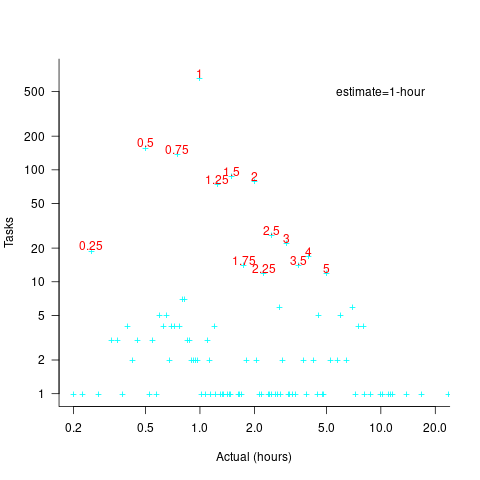
With 1-hour estimates, there is limited scope for a wide range of actual times (at least for times less than estimates). The labelled peaks contain 89% of 1-hour estimate tasks (1,525 tasks, 21% less than estimate, 44% equal estimate, 24% greater than estimate).
Tasks with larger estimated times are likely to take longer, creating more possible rounding peaks in the implementation time distribution. The plot below shows the number of tasks having a given reported implementation time, for tasks estimated to take 7-hour (i.e., 1-day), with main peaks labelled in red (reported times rounded to one decimal place and quarter hours; code+data):
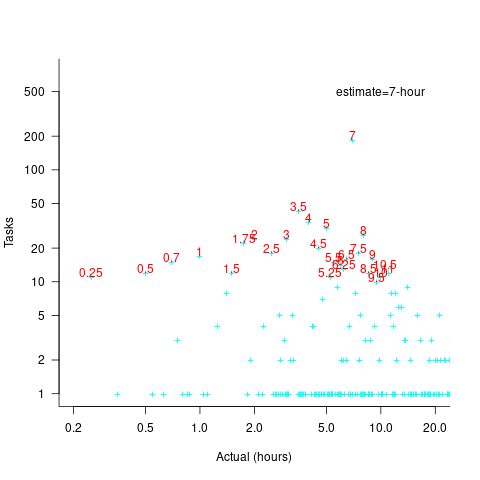
As expected, there are more peaks and implementation times are distributed over a larger range of values.
These plots suggest that many actual times are being rounded to 15-minute intervals. The plot below is based on the minute portion of the reported time (i.e., the hour part is ignored), and shows the fraction of tasks, for estimates of 1, 2, 3, 5, 7, and 14 hours, whose minute component of reported time has a given value (code+data):

For estimates of a few hours, around 90% of reported task time is on a 15-minute mark, while for 7- and 14-hour tasks the percentage drops to 80%.
If staff are manually entering task finish times, then some degree of rounding is to be expected. When the finish time is indirectly calculated, based on the submission of a completed form, there will be some fuzziness to the rounding number process.
Rereading The Mythical Man-Month
The book The Mythical Man-Month by Fred Brooks, first published in 1975, continues to be widely referenced, my 1995 edition cites over 250K copies in print. In the past I have found it to be a pleasant, relatively content free, read.
Having spent some time analyzing computing data from the 1960s, I thought it would be interesting to reread Brooks in the light of what I had recently learned. I cannot remember when I last read the book, and only keep a copy to be able to check when others cite it as a source.
Each of the 15 chapters, in the 1975 edition, takes the form of a short five/six page management briefing on some project related topic; chapters start with a picture of some work or art on one page, and a short quote from a famous source occupies the opposite page. The 20th anniversary edition adds four chapters, two of which ‘refire’ Brooks’ 1986 paper introducing the term No Silver Bullet (that no single technlogy will produce an order of magnitude improvement in productivity).
Rereading, I found the 1975 contents to be sufficiently non-specific that my newly acquired knowledge did not change anything. It was a pleasant read, various ideas and some data points are presented, the work of others is covered and cited, a few points are briefly summarised and the chapter ends. The added chapters have a different character than the earlier ones, being more detailed in their discussion and more specific in suggesting outcomes. The ‘No Silver Bullet’ material dismisses some of the various claimed discoveries of a silver bullet.
Why did the book sell so well?
The material is an easy read, and given that no solutions are heavily pushed, there is little to disagree with.
Being involved on a project for the first time can be a confusing experience, and even more experienced people get lost. Brooks can provide solace through his calm presentation of project behaviors as stuff that happens.
What project experience did Brooks have?
Brooks’ PhD thesis The Analytic Design of Automatic Data Processing Systems was completed in 1956, and, aged 25, he joined IBM that year. He was project manager for System/360 from its inception in late 1961 to its launch in April 1964. He managed the development of the operating system OS/360 from February 1964, for a year, before leaving to found the computer science department at the University of North Carolina at Chapel Hill, where he remained.
So Brooks gained a few years of hands-on experience at the start of his career and spent the rest of his life talking about it. A not uncommon career path.
Managing the development of an O/S intended to control a machine containing 16K of memory (i.e., IBM’s System/360 model 30) might not seem like a big deal. Teams of half-a-dozen good people had implemented projects like this since the 1950s. However, large companies create large teams, operating over multiple sites, with every changing requirements and interfaces, changing hardware, all with added input from marketing (IBM was/is a sales-driven organization). I suspect that the actual coding effort was a rounding error, compared to the time spent in meetings and on telephone calls.
Brooks looked after the management, and Gene Amdahl looked after the technical stuff (for lots of details see IBM’s 360 and early 370 systems by Pugh, Johnson, and Palmer).
Brooks was obviously a very capable manager. Did the O/360 project burn him out?
Analyzing mainframe data in light of the IBM antitrust cases
Issues surrounding the decades of decreasing cost/increasing performance of microcomputers, powered by Intel’s x86/Pentium have been extensively analysed. There has been a lot of analysis of pre-Intel computers, in particular Mainframe computers. Is there any major difference?
Mainframes certainly got a lot faster throughout the 1960s and 1970s, and the Computer and Automation’s monthly census shows substantial decreases in rental prices (the OCR error rate is not yet low enough for me to be willing to spend time extracting 300 pages of tabular data).
During the 1960s and 1970s the computer market was dominated by IBM, whose market share was over 70% (its nearest rivals, Sperry Rand, Honeywell, Control Data, General Electric, RCA, Burroughs, and NCR, were known as the seven dwarfs).
While some papers analyzing the mainframe market do mention that there was an antitrust case against IBM, most don’t mention it. There are some interesting papers on the evolution of families of IBM products, but how should this analysis be interpreted in light of IBM’s dominant market position?
For me, the issue of how to approach the interpretation of IBM mainframe cost/performance/sales data is provided by the book The U.S. Computer Industry: A Study of Market Power by Gerald Brock.
Brock compares the expected performance of a dominant company in a hypothetical computer industry, where anticompetitive practices do not occur, with IBM’s performance in the real world. There were a variety of mismatches (multiple antitrust actions have found IBM guilty of abusing its dominant market power).
Any abuse of market power by IBM does not impact the analysis of computer related issues about what happened in the 1950s/1960s/1970, but the possibility of this behavior introduces uncertainty into any analysis of why things happened.
Intel also had its share of antitrust cases, which will be of interest to people analysing the x86/Pentium compatible processor market.
Evidence-based Software Engineering book: the last year
It’s now three years since my book, Evidence-based Software Engineering: based on the publicly available data, was released. What has happened in the last year, since I wrote about the first two years, and what might happen in the next year or so?
There is now a Discord channel for discussing evidence-based software engineering. Blog readers and anyone with an interest in the subject are most welcome.
I keep a copy of software related papers that I think might be worth looking at again, and have been meaning to make this list public. A question by ysch, a Discord channel member, asked after ways of checking whether a software paper was worth reading. This prompted me to create a Github repo containing the titles of these 7,756 saved papers, along with some data related annotations. On the more general question of paper quality, my view is that most papers are not worth reading, with a few being very well worth reading. People have to develop techniques for rapidly filtering out the high volume of drivel; techniques I use, and understanding the publication ecosystem.
This last year saw the sudden arrival of a new tool, LLMs. My experience with using ChatGPT (and other such LLMs) as an evidence-based research tool is that the answers are too generic or just plain wrong (for several months, one LLM reported that I had a degree in Divinity Studies). If I was writing a book, I suspect that they would provide a worthwhile copy-editing service.
I was hoping that the recently released GPT-4 vision model would do high quality text extraction from scanned pdfs, but the quality of output I have received is about the same as traditional OCR-based tools. I expect that the data extraction ability LLM based tools will get a lot better, because they are at the start of the learning curve and there is a commercial incentive for them to be a lot better.
An LLM is driven by the token weights learned during training. Roughly speaking, the more training data on a topic, the larger the trained weights for that topic. There is not a lot of data (i.e., text) relating to evidence-based software engineering, compared to the huge quantities available for some topics, so responses are generic and often parrot established folklore. The following image was generated by DALL-E3:

There is a tale of software product evolution waiting to be told via the data contained in magazine adverts; the magazines are on bitsavers, we just need LLMs to be good enough to reliably extract advert contents (currently, too many hallucinations).
The book contents continue to survive almost completely unscathed, primarily because reader feedback continues to be almost non-existent. Despite the close to 500k downloads (now averaging 4k-5k downloads per month, from the logs I have, with the mobile friendly version around 10%), most people I meet have not heard of the book. The concept of an evidence-based approach to software engineering continues to be met with blank looks, although a commonly cited listener use case for the book’s data is validating a pet theory (my suggestion that the data may show their pet theory to be wrong is not appreciated).
Analysis/data in the following blog posts, from the last 12-months, belongs in the book in some form or other:
Some human biases in conditional reasoning
Unneeded requirements implemented in Waterfall & Agile
Analysis of Cost Performance Index for 338 projects
Evaluating Story point estimation error
Frequency of non-linear relationships in software engineering data
Analysis of when refactoring becomes cost-effective
An evidence-based software engineering book from 2002
Perturbed expressions may ‘recover’
Predicting the size of the Linux kernel binary
Local variable naming: some previously unexplored factors
Optimal function length: an analysis of the cited data
Some data on the size of Cobol programs/paragraphs
Hardware/Software cost ratio folklore
Criteria for increased productivity investment
Likelihood of encountering a given sequence of statements
Recent Comments