Archive
Anthropological studies of software engineering
Anthropology is the study of humans, and as such it is the top level research domain for many of the human activities involved in software engineering. What has been discovered by the handful of anthropologists who have spent time researching the tiny percentage of humans involved in writing software?
A common ‘discovery’ is that developers don’t appear to be doing what academics in computing departments claim they do; hardly news to those working in industry.
The main subfields relevant to software are probably: cultural anthropology and social anthropology (in the US these are combined under the name sociocultural anthropology), plus linguistic anthropology (how language influences social life and shapes communication). There is also historical anthropology, which is technically what historians of computing do.
For convenience, I’m labelling anybody working in an area covered by anthropology as an anthropologist.
I don’t recommend reading any anthropology papers unless you plan to invest a lot of time in some subfield. While I have read lots of software engineering papers, anthropologist’s papers on this topic are often incomprehensible to me. These papers might best be described as anthropology speak interspersed with software related terms.
Anthropologists write books, and some of them are very readable to a more general audience.
The Art of Being Human: A Textbook for Cultural Anthropology by Wesch is a beginner’s introduction to its subject.
Ethnography, which explores cultural phenomena from the point of view of the subject of the study, is probably the most approachable anthropological research. Ethnographers spend many months living with a remote tribe, community, or nowadays a software development company, and then write-up their findings in a thesis/report/book. Examples of approachable books include: “Engineering Culture: Control and Commitment in a High-Tech Corporation” by Kunda, who studied a large high-tech company in the mid-1980s; “No-Collar: The Humane Workplace and its Hidden Costs” by Ross, who studied an internet startup that had just IPO’ed, and “Coding Freedom: The Ethics and Aesthetics of Hacking” by Coleman, who studied hacker culture.
Linguistic anthropology is the field whose researchers are mostly likely to match developers’ preconceived ideas about what humanities academics talk about. If I had been educated in an environment where Greek and nineteenth century philosophers were the reference points for any discussion, then I too would use this existing skill set in my discussions of source code (philosophers of source code did not appear until the twentieth century). Who wouldn’t want to apply hermeneutics to the interpretation of source code (the field is known as Critical code studies)?
It does not help that the software knowledge of many of the academics appears to have been acquired by reading computer books from the 1940s and 1950s.
The most approachable linguistic anthropology book I have found, for developers, is: The Philosophy of Software Code and Mediation in the Digital Age by Berry (not that I have skimmed many).
Study of developers for the cost of a phase I clinical drug trial
For many years now, I have been telling people that software researchers need to be more ambitious and apply for multi-million pound/dollar grants to run experiments in software engineering. After all, NASA spends a billion or so sending a probe to take some snaps of a planet and astronomers lobby for $100million funding for a new telescope.
What kind of experimental study might be run for a few million pounds (e.g., the cost of a Phase I clinical drug trial)?
Let’s say that each experiment involves a team of professional developers implementing a software system; call this a Project. We want the Project to be long enough to be realistic, say a week.
Different people exhibit different performance characteristics, and the experimental technique used to handle this is to have multiple teams independently implement the same software system. How many teams are needed? Fifteen ought to be enough, but more is better.
Different software systems contain different components that make implementation easier/harder for those involved. To remove single system bias, a variety of software systems need to be used as Projects. Fifteen distinct Projects would be great, but perhaps we can get away with five.
How many developers are on a team? Agile task estimation data shows that most teams are small, i.e., mostly single person, with two and three people teams making up almost all the rest.
If we have five teams of one person, five of two people, and five of three people, then there are 15 teams and 30 people.
How many people will be needed over all Projects?
15 teams (30 people) each implementing one Project 5 Projects, which will require 5*30=150 people (5*15=75 teams) |
How many person days are likely to be needed?
If a 3-person team takes a week (5 days), a 2-person team will take perhaps 7-8 days. A 1-person team might take 9-10 days.
The 15 teams will consume 5*3*5+5*2*7+5*1*9=190 person days The 5 Projects will consume 5*190=950 person days |
How much is this likely to cost?
The current average daily rate for a contractor in the UK is around £500, giving an expected cost of 190*500=£475,000 to hire the experimental subjects. Venue hire is around £40K (we want members of each team to be co-located).
The above analysis involves subjects implementing one Project. If, say, each subject implements two, three or four Projects, one after the other, the cost is around £2million, i.e., the cost of a Phase I clinical drug trial.
What might we learn from having subjects implement multiple Projects?
Team performance depends on the knowledge and skill of its members, and their ability to work together. Data from these experiments would be the first of their kind, and would provide realistic guidance on performance factors such as: impact of team size; impact of practice; impact of prior experience working together; impact of existing Project experience. The multiple implementations of the same Project created provide a foundation for measuring expected reliability and theories of N-version programming.
A team of 1 developer will take longer to implement a Project than a team of 2, who will take longer than a team of 3.
If 20 working days is taken as the ballpark period over which a group of subjects are hired (i.e., a month), there are six team size sequences that one subject could work (A to F below); where individual elapsed time is close to 20 days (team size 1 is 10 days elapsed, team size 2 is 7.5 days, team size 3 is 5 days).
Team size    A      B      C      D      E      F
    1      twice   once   once
    2                     once  thrice  once
3 twice twice four |
The cost of hiring subjects+venue+equipment+support for such a study is likely to be at least £1,900,000.
If the cost of beta testing, venue hire and research assistants (needed during experimental runs) is included, the cost is close to £2.75 million.
Might it be cheaper and simpler to hire, say, 20-30 staff from a medium size development company? I chose a medium-sized company because we would be able to exert some influence over developer selection and keeping the same developers involved. The profit from 20-30 people for a month is not enough to create much influence within a large company, and a small company would not want to dedicate a large percentage of its staff for a solid month.
Beta testing is needed to validate both the specifications for each Project and that it is possible to schedule individuals to work in a sequence of teams over a month (individual variations in performance create a scheduling nightmare).
Growth in FLOPs used to train ML models
AI (a.k.a. machine learning) is a compute intensive activity, with the performance of trained models being dependent on the quantity of compute used to train the model.
Given the ongoing history of continually increasing compute power, what is the maximum compute power that might be available to train ML models in the coming years?
How might the compute resources used to train an ML model be measured?
One obvious answer is to specify the computers used and the numbers of days used they were occupied training the model. The problem with this approach is that the differences between the computers used can be substantial. How is compute power measured in other domains?
Supercomputers are ranked using FLOPS (floating-point operations per second), or GigFLOPS or PetaFLOPS ( ). The Top500 list gives values for
  (based on benchmark performance, i.e., LINNPACK) and
  (what the hardware is theoretically capable of, which is sometimes more than twice ).
A ballpark approach to measuring the FLOPs consumed by an application is to estimate the FLOPS consumed by the computers involved and multiply by the number of seconds each computer was involved in training. The huge assumption made with this calculation is that the application actually consumes all the FLOPS that the hardware is capable of supplying. In some cases this appears to be the metric used to estimate the compute resources used to train an ML model. Some published papers just list a FLOPs value, while others list the number of GPUs used (e.g., 2,128).
A few papers attempt a more refined approach. For instance, the paper describing the GPT-3 models derives its FLOPs values from quantities such as the number of parameters in each model and number of training tokens used. Presumably, the research group built a calibration model that provided the information needed to estimate FLOPS in this way.
How does one get to be able to use PetaFLOPS of compute to train a model (training the GPT-3 175B model consumed 3,640 PetaFLOP days, or around a few days on a top 8 supercomputer)?
Pay what it costs. Money buys cloud compute or bespoke supercomputers (which are more cost-effective for large scale tasks, if you have around £100million to spend plus £10million or so for the annual electricity bill). While the amount paid to train a model might have lots of practical value (e.g., can I afford to train such a model), researchers might not be keen to let everybody know how much they spent. For instance, if a research team have a deal with a major cloud provider to soak up any unused capacity, those involved probably have no interest in calculating compute cost.
How has the compute power used to train ML models increased over time? A recent paper includes data on the training of 493 models, of which 129 include estimated FLOPs, and 106 contain date and model parameter data. The data comes from published papers, and there are many thousands of papers that train ML models. The authors used various notability criteria to select papers, and my take on the selection is that it represents the high-end of compute resources used over time (which is what I’m interested in). While they did a great job of extracting data, there is no real analysis (apart from fitting equations).
The plot below shows the FLOPs training budget used/claimed/estimated for ML models described in papers published on given dates; lines are fitted regression models, and the colors are explained below (code+data):
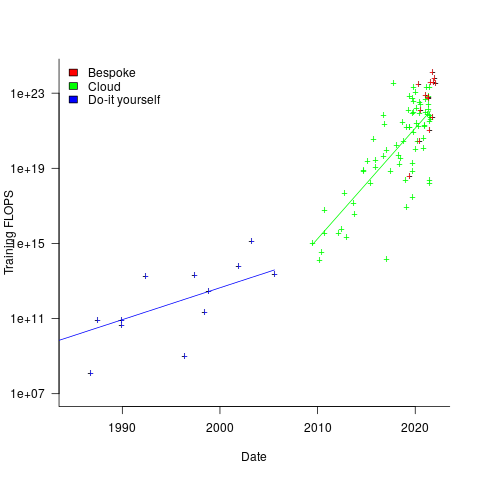
My interpretation of the data is based on the economics of accessing compute resources. I see three periods of development:
- do-it yourself (18 data points): During this period most model builders only had access to a university computer, desktop machines, or a compute cluster they had self-built,
- cloud (74 data points): Huge on demand compute resources are now just a credit card away. Researchers no longer have to wait for congested university computers to become available, or build their own systems.
AWS launched in 2006, and the above plot shows a distinct increase in compute resources around 2008.
- bespoke (14 data points): if the ML training budget is large enough, it becomes cost-effective to build a bespoke system, e.g., a supercomputer. As well as being more cost-effective, a bespoke system can also be specifically designed to handle the characteristics of the kinds of applications run.
How might models trained using a bespoke system be distinguished from those trained using cloud compute? The plot below shows the number of parameters in each trained model, over time, and there is a distinct gap between
 and
and  parameters, which I assume is the result of bespoke systems having the memory capacity to handle more parameters (code+data):
The rise in FLOPs growth rate during the Cloud period comes from several sources: 1) the exponential decline in the prices charged by providers delivers researchers an exponentially increasing compute for the same price, 2) researchers obtaining larger grants to work on what is considered to be an important topic, 3) researchers doing deals with providers to make use of excess capacity.
The rate of growth of Cloud usage is capped by the cost of building a bespoke system. The future growth of Cloud training FLOPs will be constrained by the rate at which the prices charged for a FLOP decreases (grants are unlikely to continually increase substantially).
The rate of growth of the Top500 list is probably a good indicator of the rate of growth of bespoke system performance (and this does appear to be slowing down). Perhaps specialist ML training chips will provide performance that exceeds that of the GPU chips currently being used.
The maximum compute that can be used by an application is set by the reliability of the hardware and the percentage of resources used to recover from hard errors that occur during a calculation. Supercomputer users have been facing the possibility of hitting the wall of maximum compute for over a decade. ML training is still a minnow in the supercomputer world, where calculations run for months, rather than a few days.
Cost-effectiveness decision for fixing a known coding mistake
If a mistake is spotted in the source code of a shipping software system, is it more cost-effective to fix the mistake, or to wait for a customer to report a fault whose root cause turns out to be that particular coding mistake?
The naive answer is don’t wait for a customer fault report, based on the following simplistic argument:  .
.
where:  is the cost of fixing the mistake in the code (including testing etc), and
  is the cost of finding the mistake in the code based on a customer fault report (i.e., the sum on the right is the total cost of fixing a fault reported by a customer).
If the mistake is spotted in the code for ‘free’, then  , e.g., a developer reading the code for another reason, or flagged by a static analysis tool.
This answer is naive because it fails to take into account the possibility that the code containing the mistake is deleted/modified before any customers experience a fault caused by the mistake; let  be the likelihood that the coding mistake ceases to exist in the next unit of time.
The more often the software is used, the more likely a fault experience based on the coding mistake occurs; let  be the likelihood that a fault is reported in the next time unit.
A more realistic analysis takes into account both the likelihood of the coding mistake disappearing and a corresponding fault being reported, modifying the relationship to: *{F_{experience}/M_{gone}}")
Software systems are eventually retired from service; the likelihood that the software is maintained during the next unit of time,  , is slightly less than one.
Giving the relationship: *{F_{experience}/M_{gone}}*S_{maintained}")
which simplifies to: *{F_{experience}/M_{gone}}*S_{maintained}")
What is the likely range of values for the ratio:  ?
?
I have no find/fix cost data, although detailed total time is available, i.e., find+fix time (with time probably being a good proxy for cost). My personal experience of find often taking a lot longer than fix probably suffers from survival of memorable cases; I can think of cases where the opposite was true.
The two values in the ratio  are likely to change as a system evolves, e.g., high code turnover during early releases that slows as the system matures. The value of should decrease over time, but increase with a large influx of new users.
A study by Penta, Cerulo and Aversano investigated the lifetime of coding mistakes (detected by several tools), tracking them over three years from creation to possible removal (either fixed because of a fault report, or simply a change to the code).
Of the 2,388 coding mistakes detected in code developed over 3-years, 41 were removed as reported faults and 416 disappeared through changes to the code: 
The plot below shows the survival curve for memory related coding mistakes detected in Samba, based on reported faults (red) and all other changes to the code (blue/green, code+data):
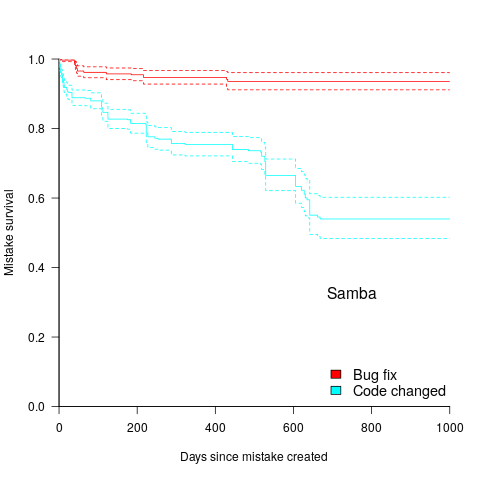
Coding mistakes are obviously being removed much more rapidly due to changes to the source, compared to customer fault reports.
For it to be cost-effective to fix coding mistakes in Samba, flagged by the tools used in this study ( is essentially one), requires:  .
.
Meeting this requirement does not look that implausible to me, but obviously data is needed.
Recent Comments