Archive
LLMs and doing software engineering research
This week I attended the 65th COW workshop, the theme was Automated Program Repair and Genetic Improvement.
I first learned about using genetic programming to automatically fix reported faults at the 1st COW workshop in 2009. Claire Le Goues, a PhD student at that workshop, now a professor, returned to talk about the latest program repair work of her research group.
COW speakers are usually very upbeat, but uncertainty about the future was the general feeling I got from speakers at this workshop. The cause of this uncertainty was the topic of some talks and conversations: LLMs. Adding an LLM into the program repair process can produce a dramatic performance improvement.
Isn’t a dramatic performance improvement and a new technique great news for everyone? The performance improvement increases the likelihood of industrial adoption, and a new technique creates many opportunities for new research.
Despite claiming otherwise, most academics have zero interest in industrial adoption of their work, and some actively disdain practical uses of their work.
Major new techniques are great for PhD students; they provide an opportunity to kick-start a career by being in at the start of a new research area.
A major new technique can obsolete an established researcher’s expensively acquired area of expertise (expensive in personal time and effort). The expertise that enables a researcher to make state-of-the-art contributions to an active research area is a valuable asset; it can be used to attract funding, students and peer esteem. When a new technique dramatically improves the state-of-the-art, there is a sharp drop in the value of what is now yesterday’s know-how.
A major new technique removes some existing barriers to entering a field, and creates its own new ones. The result is that new people start working in a field, and some existing experts stop working in it.
At the workshop, I saw this process starting in automated program repair, and I imagine it’s also starting in many other research fields. It will probably take 3–5 years for the dust to start to settle; existing funded projects have to complete, and academia does not move that quickly.
A recent review of the use of LLMs in software engineering research found 229 papers; the table below shows the number of papers per year:
    Papers   Year
       7     2020
      11     2021
      51     2022
160 2023 to end July |
Assuming, say, 10K software engineering papers per year, then LLM related papers should be around 3% this year, likely in double figures next year, and possibly over 50% the year after.
Is research in software engineering en route to becoming another subfield of prompt engineering research?
Some data on the size of Cobol programs/paragraphs
Before the internet took off in the 1990s, COBOL was the most popular language, measured in lines of code in production use. People who program in Cobol often have a strong business focus, and don’t hang out on sites used aggregated by surveys of programming language use; use of the language is almost completely invisible to those outside the traditional data processing community. So who knows how popular Cobol is today.
Despite the enormous quantity of Cobol code that has been written, very little Cobol source is publicly available (Open source or otherwise; the NIST compiler validation suite is not representative). The reason for the sparsity of source code is that Cobol programs are used to process business data, and the code is useless without the appropriate data (even with the data, the output is only likely to be of interest to a handful of people).
Program and function/method size (in LOC) are basic units of source code measurement. Until open source happened, published papers containing these measurements were based on small sample sizes and the languages covered was somewhat spotty. Cobol oriented research usually has a business orientation, rather than being programming oriented, and now there is a plentiful supply of source code written in non-Cobol languages.
I recently discovered appendix B of 1st Lt Richard E. Boone’s Master’s thesis An investigation into the use of software product metrics for COBOL systems (it’s post Rome period). Several days/awk scripts and editor macros later, LOC data for 178 programs containing 2,682 paragraphs containing 53,255 statements is now online (code+data).
A note on terminology: Cobol functions/methods are called paragraphs.
A paragraph is created by attaching a label to the first statement of the paragraph (there are no variables local to a paragraph; all variables are global). The statement PERFORM NAME-OF-PARAGRAPH ‘calls’ the paragraph labelled by NAME-OF-PARAGRAPH, somewhat like gosub number in BASIC.
It is possible to specify a sequence of paragraphs to be executed, in a PERFORM statement. The statement PERFORM NAME-OF-P1 THRU NAME-OF-P99 causes all paragraphs appearing textually in the code between the start of paragraph NAME-1 and the end of paragraph NAME-99 to be executed.
As far as I can tell, Boone’s measurements are based on individual paragraphs, not any sequences of paragraphs that are PERFORMed (it is likely that some labelled paragraphs are never PERFORMed in isolation).
Appendix B lists for each program: the paragraphs it contains, and for each paragraph the number of statements, McCabe’s complexity, maximum nesting, and Henry and Kafura’s Information flow metric
There are, based on naming, many EXIT paragraphs (711 or 26%); these are single statement paragraphs containing the statement EXIT. When encountered as the last paragraph of a PERFORM THU statement, the EXIT effectively acts like a procedure return statement; in other contexts, the EXIT statement acts like a continue statement.
In the following code the developer could have written PERFORM PARA-1 THRU PARA-4, but if a related paragraph was added between PARA-4 and PARA-END_EXIT all PERFORMs explicitly referencing PARA-4 would need to be checked to see if they needed updating to the new last paragraph.
START. PERFORM PARA-1 THRU PARA-END-EXIT. PARA-1. DISPLAY 'PARA-1'. PARA-2. DISPLAY 'PARA-2'. PARA-3. DISPLAY 'PARA-3'. P3-EXIT. EXIT. PARA-4. DISPLAY 'PARA-4'. PARA-END-EXIT. EXIT. |
The plot below shows the number of paragraphs containing a given number of statements, the red dot shows the count with EXIT paragraphs are ignored (code+data):

How does this distribution compare with that seen in C and Java? The plot below shows the Cobol data (in black, with frequency scaled-up by 1,000) superimposed on the same counts for C and Java (C/Java code+data):
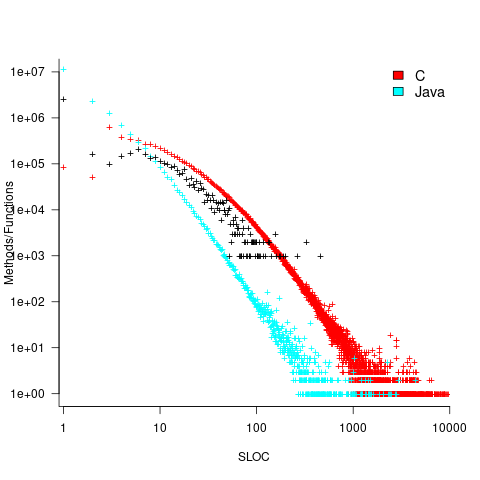
The distribution of statements per paragraph/function distribution for Cobol/C appears to be very similar, at least over the range 10-100. For less than 10-LOC the two languages have very different distributions. Is this behavior particular to the small number of Cobol programs measured? As always, more data is needed.
How many paragraphs does a Cobol program contain? The plot below shows programs ranked by the number of paragraphs they contain, including and excluding EXIT statements (code+data):
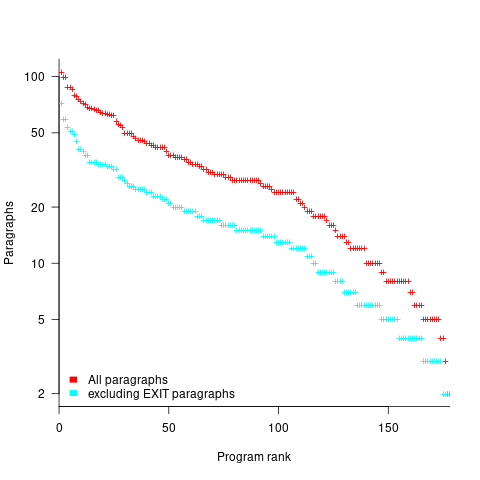
If you squint, it’s possible to imagine two distinct exponential declines, with the switch happening around the 100th program.
It’s tempting to draw some conclusions, but the sample size is too small.
Pointers to large quantities of Cobol source welcome.
Optimal function length: an analysis of the cited data
Careful analysis is required to extract reliable conclusions from data. Sloppy analysis can lead to incorrect conclusions being drawn.
The U-shaped plots cited as evidence for an ‘optimal’ number of LOC in a function/method that minimises the number of reported faults in a function, were shown to be caused by a mathematical artifact. What patterns of behavior are present in the data cited as evidence for an optimal number of LOC?
The 2000 paper Module Size Distribution and Defect Density by Malaiya and Denton summarises the data-oriented papers cited as sources on the issue of optimal length of a function/method, in LOC.
Note that the named unit of measurement in these papers is a module. In one paper, a module is specified as being as Ada package, but these papers specify that a module is a single function, method or anything else.
In order of publication year, the papers are:
The 1984 paper Software errors and complexity: an empirical investigation by Basili, and Perricone analyses measurements from a 90K Fortran program. The relevant Faults/LOC data is contained in two tables (VII and IX). Modules are sorted in to one of five bins, based on LOC, and average number of errors per thousand line of code calculated (over all modules, and just those containing at least one error); see table below:
     Module         Errors/1k lines   Errors/1k lines
     max LOC          all modules      error modules
        50              16.0               65.0
       100              12.6               33.3
       150              12.4               24.6
       200               7.6               13.4
>200 6.4 9.7 |
One of the paper’s conclusions: “One surprising result was that module size did not account for error proneness. In fact, it was quite the contrary–the larger the module, the less error-prone it was.”
The 1985 paper Identifying error-prone software—an empirical study by Shen, Yu, Thebaut, and Paulsen analyses defect data from three products (written in Pascal, PL/S, and Assembly; there were three versions of the PL/S product) were analysed using Halstead/McCabe, plus defect density, in an attempt to identify error-prone software.
The paper includes a plot (figure 4) of defect density against LOC for one of the PL/S product releases, for 108 modules out of 253 (presumably 145 modules had no reported faults). The plot below shows defects against LOC, the original did not include axis values, and the red line is the fitted regression model  (data extracted using WebPlotDigitizer; code+data):
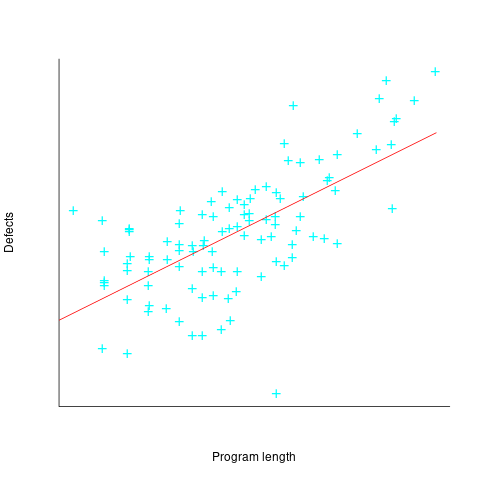
The power-law exponent is less than one, which suggests that defects per line is decreasing as module size increases, i.e., there is no optimal minimum, larger is always better. However, the analysis is incomplete because it does not include modules with zero reported defects.
The authors say: “… that there is a higher mean error rate in smaller sized modules, is consistent with that discovered by Basili and Perricone.”
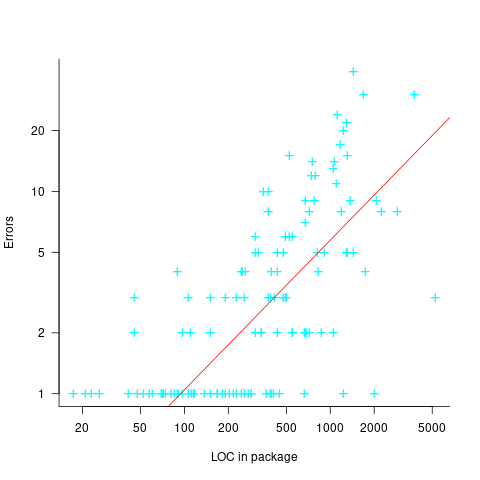
The 1990 paper Error Density and Size in Ada Software by Carol Withrow analyses error data from a 114 KLOC military communication system written in Ada; of the 362 Ada packages, 137 had at least one error. The unit of measurement is an Ada package, which like a C++ class, can contain multiple definitions of types, variables, and functions.
The paper plots errors per thousand line of code against LOC, for packages containing at least one error, i.e., 62% of packages are not included in the analysis. The 137 packages are sorted into 8-bins, based on the number of lines they contain. The 52 packages in the 159-251 LOC bin have an average of 1.8 errors per 1 KLOC, which is the lowest bin average. The author concludes: “Our study of a large Ada project shows this optimal size to be about 225 lines.”
The plot below shows errors against LOC, red line is the fitted regression model  for
for  (data extracted using WebPlotDigitizer from figure 2; code+data):
The 1993 paper An Empirical Investigation of Software Fault Distribution by Moller, and Paulish analysed four versions of a 750K product for controlling computer system utilization, written in assembler; the items measured were: DLOC (‘delta’ lines of code, DLOC, defined as “… the number of added or modified source lines of code for a version as compared to the prior version.”) and fault rate (faults per DLOC).
This paper is the first to point out that the code from multiple modules may need to be modified to fix a defect/fault/error. The following table shows the percentage of faults whose correction required changes to a given number of modules, for three releases of the product.
                   Modules
   Version  1    2    3     4     5     6
      a    78%  14%  3.4%  1.3%  0.2%  0.1%
      b    77%  18%  3.3%  1.1%  0.3%  0.4%
c 85% 12% 2.0% 0.7% 0.0% 0.0% |
Modules are binned by DLOC and various plots appear in the paper; it’s all rather convoluted. The paper summary says: “With modified code, the fault rates steadily decrease as the module size increases.”
What conclusions does the Malaiya and Denton paper draw from these papers?
They present “… a model giving influence of module size on defect density based on data that has been reported. It provides an interpretation for both declining defect density for smaller modules and gradually rising defect density for larger modules. … If small modules can be
combined into optimal sized modules without reducing cohesion significantly, than the inherent defect density may be significantly reduced.”
The conclusion I draw from these papers is that a sloppy analysis in one paper obtained a result that sounded interesting enough to get published. All the other papers find defect/error/fault rate decreasing with module size (whatever a module might be).
Halstead & McCabe metrics: The wisdom of the ancients
Study after study finds that the predictive power of both the Halstead metric and the McCabe cyclomatic complexity metric is no better than counting lines of code, for the characteristics of interest. Why do people continue to use and cite the Halstead and McCabe metrics?
My experience, talking to people, is that many believe these metrics have greater predictive power than lines of code. Sometimes I explain the situation, other times I move on.
Those who are aware of the facts often continue to use these metrics. Why do they do this?
Given the lack of alternative metrics that are more effective than lines of code, for the claimed uses of Halstead/McCabe, following the herd is the easy option (I regularly point this out to people, after explaining that Halstead/McCabe don’t do what is claimed on the tin). Tools are available to calculate the metrics; the manual effort is clicking buttons or running a command.
Why were the Halstead/McCabe metrics ‘successful’, in that they are the ones people cite/use today?
Both were formulated in the mid-1970s, when the discussion around measuring software started in earnest, so they had some first-mover advantage (within a few years they were both being suggested for use by US Military). Individuals promoted their ideas: Maurice Halstead was a senior professor, with colleagues and lots of graduate students, who advertised the metric via their publications; Thomas McCabe was working for the NSA when his famous paper was published, and went on to form a company working in the area of source code analysis.
The Halstead/McCabe metrics can both be calculated by processing the source one line at a time (just count decision points for McCabe, no need for the pretentious graph theory stuff). In the 1970s, computer memory was often measured in kilobytes, which made it difficult to implement complicated metrics that required keeping dependency information in memory.
Metrics based on the subroutine/function/procedure/method as the measured unit of source code had an implementation and usage advantage over metrics based on larger units of code.
In the 1990s, object-oriented programming, in the form of C++ and then Java, took off. The common view, by those caught up in the times, was that object-oriented software was so different from what went before that it needed its own metrics.
The 1991 paper: Towards a Metrics Suite for Object Oriented Design, by Chidamber and Kemerer, introduced the six CK metrics (as they become known; 1992 update). The nearest this paper comes to citing the Halstead/McCabe work is to say: “Some early work has recognized the shortcomings of existing metrics and the need for new metrics especially designed for OO.” The paper followed in the footsteps of the earlier work in not providing any evidence for the claims made (the update contains histograms of metric values from a C++ project and a Smalltalk project).
The 1996 paper: Evaluating the Impact of Object-Oriented Design on Software Quality, by Abreu and Melo, introduced the MOOD metrics (Metrics for Object-Oriented Design).
At the end of 2022 the total citation counts returned by Google Scholar were: McCabe 8,670, Halstead 4,900, CK 8,160, and MOOD 354.
The plot below shows the number of new citations returned by Google Scholar, each year, for the respective metrics papers (or book for Halstead; code+data):
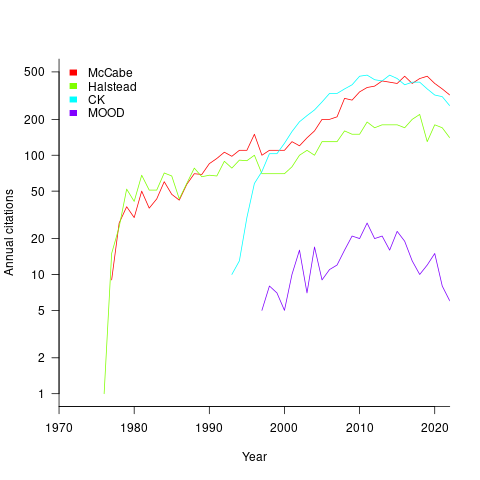
The ongoing growth in annual rate of citation probably has more to do with the growth in the number of software papers published each year, rather than these metric papers being cited by an expanding number of research fields.
Do authors tend to cite one or the other of Halstead/McCabe, or both?
Using Google Scholar’s ‘search within’ option to find the subset of papers that included a string matching the title of a paper: 46% of the Halstead citations include a citation of the McCabe paper, and 25% of the McCabe citations include a citation of the Halstead paper.
The Inciteful’s paper network (with citation counts: Halstead 1,052 and McCabe 4,970) found 657 papers citing both (62% of the Halstead total, 12% of the McCabe).
It’s not possible to make use of the OpenCitations API because it is DOI based, and the Halstead citation is a book.
Recent Comments