Archive
Optimal function length: an analysis of the cited data
Careful analysis is required to extract reliable conclusions from data. Sloppy analysis can lead to incorrect conclusions being drawn.
The U-shaped plots cited as evidence for an ‘optimal’ number of LOC in a function/method that minimises the number of reported faults in a function, were shown to be caused by a mathematical artifact. What patterns of behavior are present in the data cited as evidence for an optimal number of LOC?
The 2000 paper Module Size Distribution and Defect Density by Malaiya and Denton summarises the data-oriented papers cited as sources on the issue of optimal length of a function/method, in LOC.
Note that the named unit of measurement in these papers is a module. In one paper, a module is specified as being as Ada package, but these papers specify that a module is a single function, method or anything else.
In order of publication year, the papers are:
The 1984 paper Software errors and complexity: an empirical investigation by Basili, and Perricone analyses measurements from a 90K Fortran program. The relevant Faults/LOC data is contained in two tables (VII and IX). Modules are sorted in to one of five bins, based on LOC, and average number of errors per thousand line of code calculated (over all modules, and just those containing at least one error); see table below:
     Module         Errors/1k lines   Errors/1k lines
     max LOC          all modules      error modules
        50              16.0               65.0
       100              12.6               33.3
       150              12.4               24.6
       200               7.6               13.4
>200 6.4 9.7 |
One of the paper’s conclusions: “One surprising result was that module size did not account for error proneness. In fact, it was quite the contrary–the larger the module, the less error-prone it was.”
The 1985 paper Identifying error-prone software—an empirical study by Shen, Yu, Thebaut, and Paulsen analyses defect data from three products (written in Pascal, PL/S, and Assembly; there were three versions of the PL/S product) were analysed using Halstead/McCabe, plus defect density, in an attempt to identify error-prone software.
The paper includes a plot (figure 4) of defect density against LOC for one of the PL/S product releases, for 108 modules out of 253 (presumably 145 modules had no reported faults). The plot below shows defects against LOC, the original did not include axis values, and the red line is the fitted regression model  (data extracted using WebPlotDigitizer; code+data):
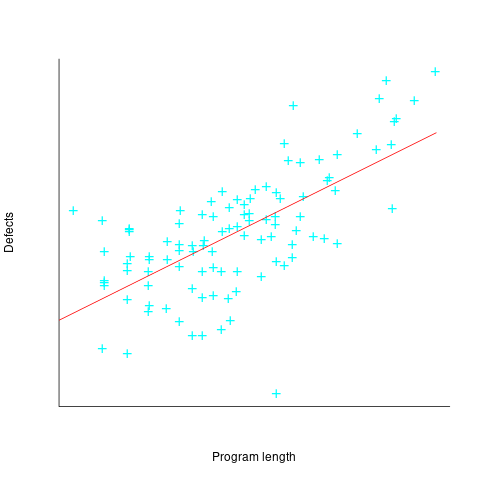
The power-law exponent is less than one, which suggests that defects per line is decreasing as module size increases, i.e., there is no optimal minimum, larger is always better. However, the analysis is incomplete because it does not include modules with zero reported defects.
The authors say: “… that there is a higher mean error rate in smaller sized modules, is consistent with that discovered by Basili and Perricone.”
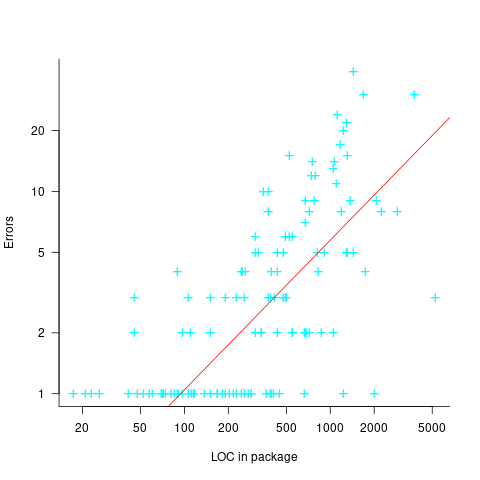
The 1990 paper Error Density and Size in Ada Software by Carol Withrow analyses error data from a 114 KLOC military communication system written in Ada; of the 362 Ada packages, 137 had at least one error. The unit of measurement is an Ada package, which like a C++ class, can contain multiple definitions of types, variables, and functions.
The paper plots errors per thousand line of code against LOC, for packages containing at least one error, i.e., 62% of packages are not included in the analysis. The 137 packages are sorted into 8-bins, based on the number of lines they contain. The 52 packages in the 159-251 LOC bin have an average of 1.8 errors per 1 KLOC, which is the lowest bin average. The author concludes: “Our study of a large Ada project shows this optimal size to be about 225 lines.”
The plot below shows errors against LOC, red line is the fitted regression model  for
for  (data extracted using WebPlotDigitizer from figure 2; code+data):
The 1993 paper An Empirical Investigation of Software Fault Distribution by Moller, and Paulish analysed four versions of a 750K product for controlling computer system utilization, written in assembler; the items measured were: DLOC (‘delta’ lines of code, DLOC, defined as “… the number of added or modified source lines of code for a version as compared to the prior version.”) and fault rate (faults per DLOC).
This paper is the first to point out that the code from multiple modules may need to be modified to fix a defect/fault/error. The following table shows the percentage of faults whose correction required changes to a given number of modules, for three releases of the product.
                   Modules
   Version  1    2    3     4     5     6
      a    78%  14%  3.4%  1.3%  0.2%  0.1%
      b    77%  18%  3.3%  1.1%  0.3%  0.4%
c 85% 12% 2.0% 0.7% 0.0% 0.0% |
Modules are binned by DLOC and various plots appear in the paper; it’s all rather convoluted. The paper summary says: “With modified code, the fault rates steadily decrease as the module size increases.”
What conclusions does the Malaiya and Denton paper draw from these papers?
They present “… a model giving influence of module size on defect density based on data that has been reported. It provides an interpretation for both declining defect density for smaller modules and gradually rising defect density for larger modules. … If small modules can be
combined into optimal sized modules without reducing cohesion significantly, than the inherent defect density may be significantly reduced.”
The conclusion I draw from these papers is that a sloppy analysis in one paper obtained a result that sounded interesting enough to get published. All the other papers find defect/error/fault rate decreasing with module size (whatever a module might be).
Impact of function size on number of reported faults
Are longer functions more likely to contain more coding mistakes than shorter functions?
Well, yes. Longer functions contain more code, and the more code developers write the more mistakes they are likely to make.
But wait, the evidence shows that most reported faults occur in short functions.
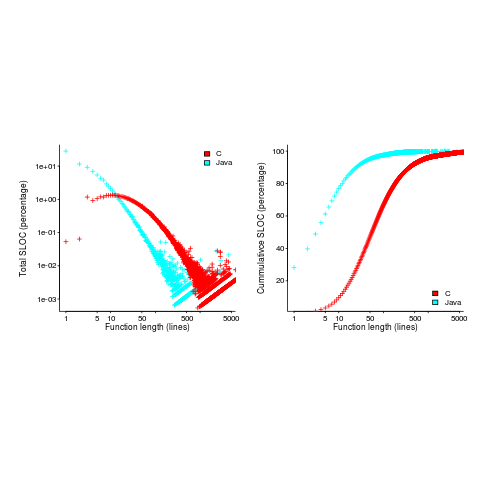
This is true, at least in Java. It is also true that most of a Java program’s code appears in short methods (in C 50% of the code is contained in functions containing 114 or fewer lines, while in Java 50% of code is contained in methods containing 4 or fewer lines). It is to be expected that most reported faults appear in short functions. The plot below shows, left: the percentage of code contained in functions/methods containing a given number of lines, and right: the cumulative percentage of lines contained in functions/methods containing less than a given number of lines (code+data):
Does percentage of program source really explain all those reported faults in short methods/functions? Or are shorter functions more likely to contain more coding mistakes per line of code, than longer functions?
Reported faults per line of code is often referred to as: defect density.
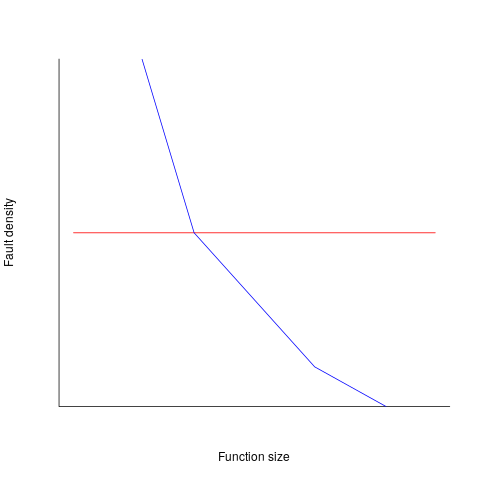
If defect density was independent of function length, the plot of reported faults against function length (in lines of code) would be horizontal; red line below. If every function contained the same number of reported faults, the plotted line would have the form of the blue line below.
Two things need to occur for a fault to be experienced. A mistake has to appear in the code, and the code has to be executed with the ‘right’ input values.
Code that is never executed will never result in any fault reports.
In a function containing 100 lines of executable source code, say, 30 lines are rarely executed, they will not contribute as much to the final total number of reported faults as the other 70 lines.
How does the average percentage of executed LOC, in a function, vary with its length? I have been rummaging around looking for data to help answer this question, but so far without any luck (the llvm code coverage report is over all tests, rather than per test case). Pointers to such data very welcome.
Statement execution is controlled by if-statements, and around 17% of C source statements are if-statements. For functions containing between 1 and 10 executable statements, the percentage that don’t contain an if-statement is expected to be, respectively: 83, 69, 57, 47, 39, 33, 27, 23, 19, 16. Statements contained in shorter functions are more likely to be executed, providing more opportunities for any mistakes they contain to be triggered, generating a fault experience.
Longer functions contain more dependencies between the statements within the body, than shorter functions (I don’t have any data showing how much more). Dependencies create opportunities for making mistakes (there is data showing dependencies between files and classes is a source of mistakes).
The previous analysis makes a large assumption, that the mistake generating a fault experience is contained in one function. This is true for 70% of reported faults (in AspectJ).
What is the distribution of reported faults against function/method size? I don’t have this data (pointers to such data very welcome).
The plot below shows number of reported faults in C++ classes (not methods) containing a given number of lines (from a paper by Koru, Eman and Mathew; code+data):
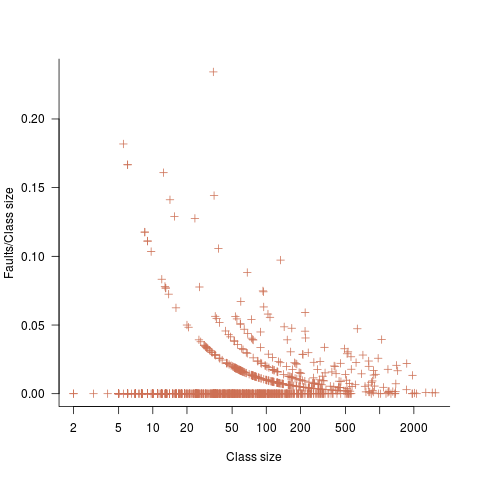
It’s tempting to think that those three curved lines are each classes containing the same number of methods.
What is the conclusion? There is one good reason why shorter functions should have more reported faults, and another good’ish reason why longer functions should have more reported faults. Perhaps length is not important. We need more data before an answer is possible.
Recent Comments