Archive
Reliability chapter of ‘evidence-based software engineering’ updated
The Reliability chapter of my evidence-based software engineering book has been updated (draft pdf).
Unlike the earlier chapters, there were no major changes to the initial version from over 18-months ago; we just don’t know much about software reliability, and there is not much public data.
There are lots of papers published claiming to be about software reliability, but they are mostly smoke-and-mirror shows derived from work down one of several popular rabbit holes:
- Machine learning is a popular technique for fault prediction, and I have written about what a train wreck this research is, along with the incomplete and very noisy data that makes nearly every attempt at fault prediction a waste of time.
- Mutation testing sounds like a technique that would be useful (and it is for pumping out papers), but it has the fatal flaw of telling people what they already know (i.e., that their test suites are not very good), and targeting coding mistakes that represent around 5% of known fault experiences (around 5% of all fixes to reported faults involve changing one line; most mutation testing works by modifying a single line of code).
- Other researchers are busily adding more epicycles to models based on the nonhomogeneous Poisson process.
The growth in research on Fuzzing is the only good news (especially with the availability of practical introductory material).
There is one source of fault experience data that looks like it might be very useful, but it’s hard to get hold of; NASA has kept detailed about what happened using space missions. I have had several people promise to send me data, but none has arrived yet :-(.
Updating the reliability chapter did not take too much time, so I updated earlier chapters with data that has arrived since they were last released.
As always, if you know of any interesting software engineering data, please tell me.
Next, the Source code chapter.
The Renzo Pomodoro dataset
Estimating how long it will take to complete a task is hard work, and the most common motivation for this work comes from external factors, e.g., the boss, or a potential client asks for an estimate to do a job.
People also make estimates for their own use, e.g., when planning work for the day. Various processes and techniques have been created to help structure the estimation process; for developers there is the Personal Software Process, and specifically for time estimation (but not developer specific), there is the Pomodoro Technique.
I met Renzo Borgatti at the first talk I gave on the SiP dataset (Renzo is the organizer of the Papers We Love meetup). After the talk, Renzo told me about his use of the Pomodoro Technique, and how he had 10-years worth of task estimates; wow, I was very interested. What happened next, and a work-in-progress analysis (plus data and R scripts) of the data can be found in the Renzo Pomodoro dataset repo.
The analysis progressed in fits and starts; like me Renzo is working on a book, and is very busy. The work-in-progress pdf is reasonably consistent.
I had never seen a dataset of estimates made for personal use, and had not read about the analysis of such data. When estimates are made for consumption by others, the motives involved in making the estimate can have a big impact on the values chosen, e.g., underestimating to win a bid, or overestimating to impress the boss by completing a task under budget. Is a personal estimate motive free? The following plot led me to ask Renzo if he was superstitious (in not liking odd numbers).
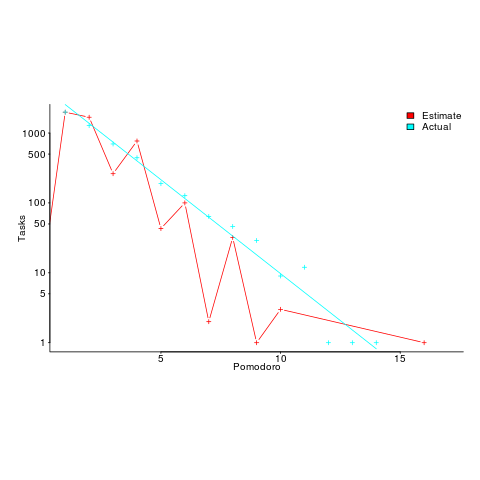
The plot shows the number of tasks for which there are a given number of estimates and actuals (measured in Pomodoros, i.e., units of 25 minutes). Most tasks are estimated to require one Pomodoro, and actually require this amount of effort.
Renzo educated me about the details of the Pomodoro technique, e.g., there is a 15-30 minute break after every four Pomodoros. Did this mean that estimates of three Pomodoros were less common because the need for a break was causing Renzo to subconsciously select an estimate of two or four Pomodoro? I am not brave enough to venture an opinion about what is going on in Renzo’s head.
Each estimated task has an associated tag name (sometimes two), which classifies the work involved, e.g., @planning. In the task information these tags have the form @word; I refer to them as at-words. The following plot is very interesting; it shows the date of use of each at-word, over time (ordered by first use of the at-word).
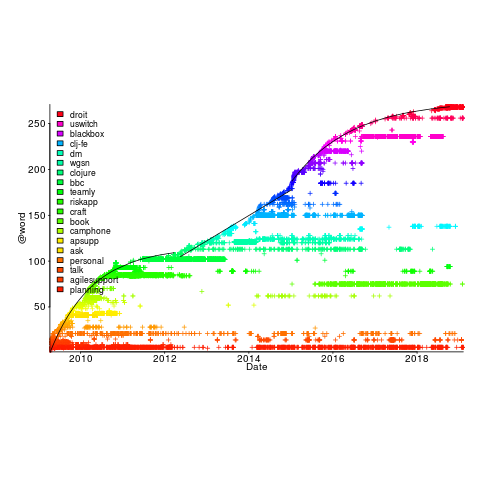
The first and third black lines are fitted regression models of the form  , where:
  is a constant and
  is the number of days since the start of the interval fitted. The second (middle) black line is a fitted straight line.
The slow down in the growth of new at-words suggests (at least to me) a period of time working in the same application domain (which involves a fixed number of distinct activities, that are ‘discovered’ by Renzo over time). More discussion with Renzo is needed to see if we can tie this down to what he was working on at the time.
I have looked for various other patterns and associations, involving at-words, but have not found any (but I did learn some new sequence analysis techniques, and associated R packages).
The data is now out there. What patterns and associations can you find?
Renzo tells me that there is a community of people using the Pomodoro technique. I’m hoping that others users of this technique, involved in software development, have recorded their tasks over a long period (I don’t think I could keep it up for longer than a week).
Perhaps there are PSP followers out there with data…
I offer to do a free analysis of software engineering data, provided I can make data public (in anonymized form). Do get in touch.
Calculating statement execution likelihood
In the following code, how often will the variable b be incremented, compared to a?
If we assume that the variables x and y have values drawn from the same distribution, then the condition (x < y) will be true 50% of the time (ignoring the situation where both values are equal), i.e., b will be incremented half as often as a.
a++; if (x < y) { b++; if (x < z) { c++; } } |
If the value of z is drawn from the same distribution as x and y, how often will c be incremented compared to a?
The test (x < y) reduces the possible values that x can take, which means that in the comparison (x < z), the value of x is no longer drawn from the same distribution as z.
Since we are assuming that z and y are drawn from the same distribution, there is a 50% chance that (z < y).
If we assume that (z < y), then the values of x and z are drawn from the same distribution, and in this case there is a 50% change that (x < z) is true.
Combining these two cases, we deduce that, given the statement a++; is executed, there is a 25% probability that the statement c++; is executed.
If the condition (x < z) is replaced by (x > z), the expected probability remains unchanged.
If the values of x, y, and z are not drawn from the same distribution, things get complicated.
Let's assume that the probability of particular values of x and y occurring are  and
and  , respectively. The constants
  and
and  are needed to ensure that both probabilities sum to one; the exponents
  and
and  control the distribution of values. What is the probability that
 (x < y) is true?
Probability theory tells us that  = int{-infty}{+infty} f_B(x) F_A(x) dx") , where:
, where:  is the probability distribution function for
  (in this case:
  ), and
  the cumulative probability distribution for
  (in this case:
 ") ).
).
Doing the maths gives the probability of (x < y) being true as:  .
.
The (x < z) case can be similarly derived, and combining everything is just a matter of getting the algebra right; it is left as an exercise to the reader :-)
Christmas books for 2019
The following are the really, and somewhat, interesting books I read this year. I am including the somewhat interesting books to bulk up the numbers; there are probably more books out there that I would find interesting. I just did not read many books this year, what with Amazon recommends being so user unfriendly, and having my nose to the grindstone finishing a book.
First the really interesting.
I have already written about Good Enough: The Tolerance for Mediocrity in Nature and Society by Daniel Milo.
I have also written about The European Guilds: An economic analysis by Sheilagh Ogilvie. Around half-way through I grew weary, and worried readers of my own book might feel the same. Ogilvie nails false beliefs to the floor and machine-guns them. An admirable trait in someone seeking to dispel the false beliefs in current circulation. Some variety in the nailing and machine-gunning would have improved readability.
Moving on to first half really interesting, second half only somewhat.
“In search of stupidity: Over 20 years of high-tech marketing disasters” by Merrill R. Chapman, second edition. This edition is from 2006, and a third edition is promised, like now. The first half is full of great stories about the successes and failures of computer companies in the 1980s and 1990s, by somebody who was intimately involved with them in a sales and marketing capacity. The author does not appear to be so intimately involved, starting around 2000, and the material flags. Worth buying for the first half.
Now the somewhat interesting.
“Can medicine be cured? The corruption of a profession” by Seamus O’Mahony. All those nonsense theories and practices you see going on in software engineering, it’s also happening in medicine. Medicine had a golden age, when progress was made on finding cures for the major diseases, and now it’s mostly smoke and mirrors as people try to maintain the illusion of progress.
“Who we are and how we got here” by David Reich (a genetics professor who is a big name in the field), is the story of the various migrations and interbreeding of ‘human-like’ and human peoples over the last 50,000 years (with some references going as far back as 300,000 years). The author tries to tell two stories, the story of human migrations and the story of the discoveries made by his and other people’s labs. The mixture of stories did not work for me; the story of human migrations/interbreeding was very interesting, but I was not at all interested in when and who discovered what. The last few chapters went off at a tangent, trying to have a politically correct discussion about identity and race issues. The politically correct class are going to hate this book’s findings.
“The Digital Party: Political organization and online democracy” by Paolo Gerbaudo. The internet has enabled some populist political parties to attract hundreds of thousands of members. Are these parties living up to their promises to be truly democratic and representative of members wishes? No, and Gerbaudo does a good job of explaining why (people can easily join up online, and then find more interesting things to do than read about political issues; only a few hard code members get out from behind the screen and become activists).
Suggestions for books that you think I might find interesting welcome.
Recent Comments