Archive
Agile and Waterfall as community norms
While rapidly evolving computer hardware has been a topic of frequent public discussion since the first electronic computer, it has taken over 40 years for the issue of rapidly evolving customer requirements to become a frequent topic of public discussion (thanks to the Internet).
The following quote is from the Opening Address, by Andrew Booth, of the 1959 Working Conference on Automatic Programming of Digital Computers (published as the first “Annual Review in Automatic Programming”):
'Users do not know what they wish to do.' This is a profound truth. Anyone who has had the running of a computing machine, and, especially, the running of such a machine when machines were rare and computing time was of extreme value, will know, with exasperation, of the user who presents a likely problem and who, after a considerable time both of machine and of programmer, is presented with an answer. He then either has lost interest in the problem altogether, or alternatively has decided that he wants something else. |
Why did the issue of evolving customer requirements lurk in the shadows for so long?
Some of the reasons include:
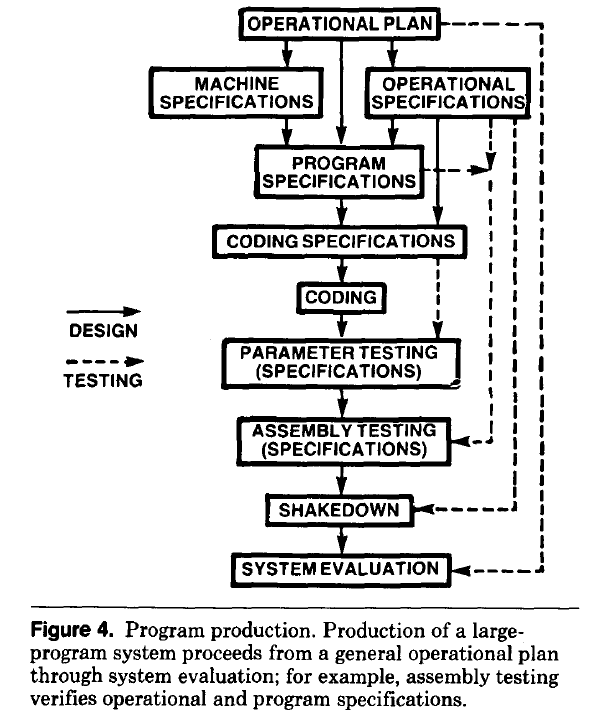
- established production techniques were applied to the process of building software systems. What is now known in software circles as the Waterfall model was/is an established technique. The figure below is from the 1956 paper Production of Large Computer Programs by Herbert Benington (Winston Royce’s 1970 paper has become known as the paper that introduced Waterfall, but the contents actually propose adding iterations to what Royce treats as an established process):
- management do not appreciate how quickly requirements can change (at least until they have experience of application development). In the 1980s, when microcomputers were first being adopted by businesses, I had many conversations with domain experts who were novice programmers building their first application for their business/customers. They were invariably surprised by the rate at which requirements changed, as development progressed.
While in public the issue lurked in the shadows, my experience is that projects claiming to be using Waterfall invariably had back-channel iterations, and requirements were traded, i.e., drop those and add these. Pre-Internet, any schedule involving more than two releases a year could be claimed to be making frequent releases.
Managers claimed to be using Waterfall because it was what everybody else did (yes, some used it because it was the most effective technique for their situation, and on some new projects it may still be the most effective technique).
Now that the issue of rapidly evolving requirements is out of the closet, what’s to stop Agile, in some form, being widely used when ‘rapidly evolving’ needs to be handled?
Discussion around Agile focuses on customers and developers, with middle management not getting much of a look-in. Companies using Agile don’t have many layers of management. Switching to Agile results in a lot of power shifting from middle management to development teams, in fact, these middle managers now look surplus to requirements. No manager is going to support switching to a development approach that makes them redundant.
Adam Yuret has another theory for why Agile won’t spread within enterprises. Making developers the arbiters of maximizing customer value prevents executives mandating new product features that further their own agenda, e.g., adding features that their boss likes, but have little customer demand.
The management incentives against using Agile in practice does not prevent claims being made about using Agile.
Now that Agile is what everybody claims to be using, managers who don’t want to stand out from the crowd find a way of being part of the community.
How did Agile become the product development zeitgeist?
From the earliest days of computing, people/groups have proposed software development techniques, and claiming them to be effective/productive ways of building software systems. Agile escaped this well of widely unknowns to become the dominant umbrella term for a variety of widely used software development methodologies (I’m talking about the term Agile, not any of the multitude of techniques claiming to be the true Agile way). How did this happen?
The Agile Manifesto was published in 2001, just as commercial use of the Internet was going through its exponential growth phase.
During the creation of a new market, as the Internet then was, there are no established companies filling the various product niches; being first to market provides an opportunity for a company to capture and maintain a dominate market share. Having a minimal viable product, for customers to use today, is critical.
In a fast-growing market, product functionality is likely to be fluid until good enough practices are figure out, i.e., there is a lack of established products whose functionality new entrants need to match or exceed.
The Agile Manifesto’s principles of early, continuous delivery, and welcoming of changing requirements are great strategic advice for building products in a new fast-growing market.
Now, I’m not saying that the early Internet based companies were following a heavy process driven approach, discovered Agile and switched to this new technique. No.
I’m claiming that the early Internet based companies were releasing whatever they had, with a few attracting enough customers to fund further product development. Based on customer feedback, or not, support was added for what were thought to be useful new features. If the new features kept/attracted customers, the evolution of the product could continue. Did these companies describe their development process as throw it at the wall and see what sticks? Claiming to be following sound practices, such as doing Agile, enables a company to appear to be in control of what they are doing.
The Internet did more than just provide a new market, it also provided a mechanism for near instantaneous zero cost product updates. The time/cost of burning thousands of CDs and shipping them to customers made continuous updates unrealistic, pre-Internet. Low volume shipments used to be made to important customers (when developing a code generator for a new computer, I sometimes used to receive OS updates on a tape, via the post-office).
The Agile zeitgeist comes from its association with many, mostly Internet related, successful software projects.
While an Agile process works well in some environments (e.g., when the development company can decide to update the software, because they run the servers), it can be problematic in others.
Agile processes are dependent on customer feedback, and making updates available via the Internet does not guarantee that customers will always install the latest version. Building software systems under contract, using an Agile process, only stands a chance of reaping any benefits when the customer is a partner in the same process, e.g., not using a Waterfall approach like the customer did in the Surrey police SIREN project.
Agile was in the right place at the right time.
Median system cpu clock frequency over last 15 years
We are all familiar with graphs showing the growth of cpu clock frequency over time. The data for these plots is based on vendor announcements listing the characteristics of their latest products, and invariably focuses on the product which is the fastest or contains the most transistors or the lowest power consumption.
Some customers buy the cpu with the highest/most/lowest, but many are happy to pay less for, for good enough. What does a graph of average customer cpu clock frequency over time look like?
Vendors sometimes publish general sales figures, but I have never seen one broken down by clock frequency. However, a few sites collect user system data, including:
- A subset of the Linux Counter project data is available. This does not contain explicit date information, but a must-be-later-than date can be inferred from the listed Linux kernel version,
- Hardware for BSD has data going back to December 2014, but there is no obvious way to extract it (I have not tried that hard),
- the BSDstats project (variable website availability) has been collecting data on machines running some derivative of BSD since August 2008; it contains around 200 times more cpu data than the known Linux Counter data. While the raw data is not available, approximately monthly reports are available on the Wayback Machine.
A BSDstats cpu history was obtained using waybackpack to download the available stored cpu summary pages, followed by html2text, and an awk script to extract the cpu frequency/count data.
BSDstats obtains the cpu information via a call to the sysctl command. For many Intel processors, but not AMD processors, the returned string includes the frequency (to see your cpu information on Linux systems type: more /proc/cpu), for instance:
Celeron(R) CPU 2.80GHz | 336 Pentium(R) 4 CPU 3.00GHz | 258 Pentium(R) 4 CPU 2.40GHz | 170 Athlon(tm) 64 Processor 3000+ | 43 Athlon(tm) 64 X2 Dual Core Processor 4200+ | 28 Athlon(tm) 64 Processor 3500+ | 27 |
For simplicity, only those rows containing frequency information were used in this analysis; 67% of the strings explicitly included a frequency (this saved me having to build a table to map AMD cpu strings to their corresponding frequency).
The plot below shows median cpu frequency (in red), along with the top/bottom 10% cpu frequencies, based on the Wayback Machine’s copy of the webpage on a given date, for a total of 2,304,446 cpu identities (code+data):
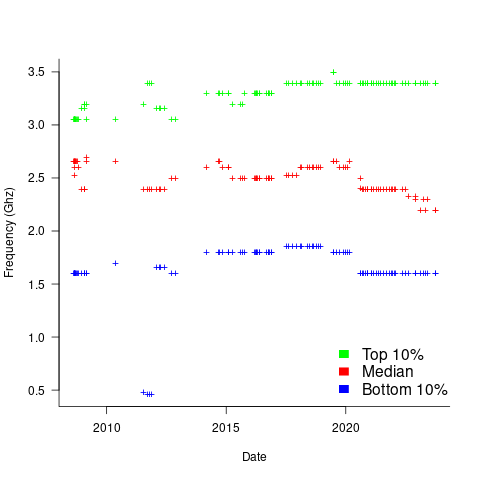
Broadly, the plot shows that cpu frequencies have essentially remained unchanged since 2008, with systems running BSD having a median frequency of 2.5 GHz, with 10% of systems having a frequency over 3.5 GHz, and 10% of systems a frequency below 1.5 GHz.
I was surprised at how many different frequencies were present in the data; often over 50. A look at the large number of different versions of Intel x86 cpus suggests that this is to be expected.
How representative is this sample of BSD systems, compared to the many more systems running Linux and Windows?
This begs the question of what kinds of environments are being compared. Are these desktop systems, local or hosted clusters, cloud systems?
The plot below shows the total number of cpus summarised on each Wayback Machine snapshot (code+data):

A few thousand systems are likely to be personal desktop systems, while the tens of thousands are likely to be clusters or small cloud providers.
Pointers to more data, particularly pre-2000, most welcome.
Documentation as a signal of program size
Developers and researchers invariably measure program size in lines of code, while senior managers measure by resources consumed per accounting period, e.g., money and people.
What size signals are visible to the users of a program?
Before CDs became generally available at the start of the 1990s, software for desktop computers was delivered on floppy discs that did not have the capacity to hold documentation (i.e., 128K to 1.4M), which was distributed in printed book form.
For instance, the first version of Turbo Pascal came with one 5¼ floppy (the compiler+IDE occupied 28K) and a 276-page reference manual.
Today, people are familiar with the intangible nature of software. In previous ages, people wanted to see and feel something for their money, and printed manuals were the substance they received (some products attached the floppies inside the back covers). Physical manuals were also thought to reduce software piracy (when CDs arrived, there was lots of hand-wringing over including electronic manuals).
Microsoft Windows bucked the trend, distributed with almost no physical paper, but many floppies; 13 3½ floppies for the initial upgrade to Windows 95, and 26 for Service Release 2 (oh, the fun of spending an afternoon swapping disks to rebuild a machine). Microsoft Office 97 standard edition was available on 45 floppies, the professional edition on 55.
The problem with distributing manuals in printed book form is that updates are costly; customers need a whole new book and the existing inventory needs to be scrapped. Documentation for Mainframe/Minicomputer/Workstations came in ring binders, allowing updates on an individual page basis. The Sun 4 that arrived at my office (to have a COBOL code generator written for the SPARC cpu) came with around 3-feet of ring binders. I have seen offices with a wall of shelves filled with vendor ring binders.
Is there any correlation between a project’s lines of code and pages of it’s documentation?
Most developers hate writing documentation; readmes don’t count. This means that only (well) funded development projects are likely to pay for an author to produce some amount of non-trivial documentation (a widely used application eventually attracts an external author interested in explaining things). Some Open source projects do contain files believed to be documentation; documentation research is primarily focused on accuracy (see section 6.4.4).
The only data I am aware of containing LOC, documentation page counts, and development man months is the 1979 paper The Characteristics of Large Systems by Belady and Lehman, which lists values for 37 “… independent programs developed in a large software house.” How much of the documentation was user focused, requirements+business logic, or developer focused? I have no idea (a fitted regression model, code+data, shows an almost linear relationship between LOC and document pages). Tests are not broken out as a separate item (code, documentation, not recorded?)
The plot below shows delivered: source lines of code, documentation pages, and total man months, x/y-axis both using log scales (code+data):

The total man months of implementation for each project is taken up by writing the code and documentation. The following equation is a good fit (explaining just 80% of the variance; code+data):  , but is only slightly better than
  . Given the high correlation between
  and
and  , including both in the same model is probably not a good idea (the equation:
  explains just over 50% of the variance).
There are a few possible outliers in the data. Perhaps removing these would make the picture clearer.
For me, what stands out, compared to today’s projects, is the relatively low DSLOC (a few tens of thousands) and high pages of documentation (thousands). Projects could be smaller/simpler in the 1970s because they were often replacing humans doing the work, not previously written systems; or, perhaps projects were limited by available computer memory, often well less than a megabyte. Perhaps I think the page count is high because I don’t have an accurate idea of how much online documentation is created these days.
Recent Comments