Median system cpu clock frequency over last 15 years
We are all familiar with graphs showing the growth of cpu clock frequency over time. The data for these plots is based on vendor announcements listing the characteristics of their latest products, and invariably focuses on the product which is the fastest or contains the most transistors or the lowest power consumption.
Some customers buy the cpu with the highest/most/lowest, but many are happy to pay less for, for good enough. What does a graph of average customer cpu clock frequency over time look like?
Vendors sometimes publish general sales figures, but I have never seen one broken down by clock frequency. However, a few sites collect user system data, including:
- A subset of the Linux Counter project data is available. This does not contain explicit date information, but a must-be-later-than date can be inferred from the listed Linux kernel version,
- Hardware for BSD has data going back to December 2014, but there is no obvious way to extract it (I have not tried that hard),
- the BSDstats project (variable website availability) has been collecting data on machines running some derivative of BSD since August 2008; it contains around 200 times more cpu data than the known Linux Counter data. While the raw data is not available, approximately monthly reports are available on the Wayback Machine.
A BSDstats cpu history was obtained using waybackpack to download the available stored cpu summary pages, followed by html2text, and an awk script to extract the cpu frequency/count data.
BSDstats obtains the cpu information via a call to the sysctl command. For many Intel processors, but not AMD processors, the returned string includes the frequency (to see your cpu information on Linux systems type: more /proc/cpu), for instance:
Celeron(R) CPU 2.80GHz | 336 Pentium(R) 4 CPU 3.00GHz | 258 Pentium(R) 4 CPU 2.40GHz | 170 Athlon(tm) 64 Processor 3000+ | 43 Athlon(tm) 64 X2 Dual Core Processor 4200+ | 28 Athlon(tm) 64 Processor 3500+ | 27 |
For simplicity, only those rows containing frequency information were used in this analysis; 67% of the strings explicitly included a frequency (this saved me having to build a table to map AMD cpu strings to their corresponding frequency).
The plot below shows median cpu frequency (in red), along with the top/bottom 10% cpu frequencies, based on the Wayback Machine’s copy of the webpage on a given date, for a total of 2,304,446 cpu identities (code+data):
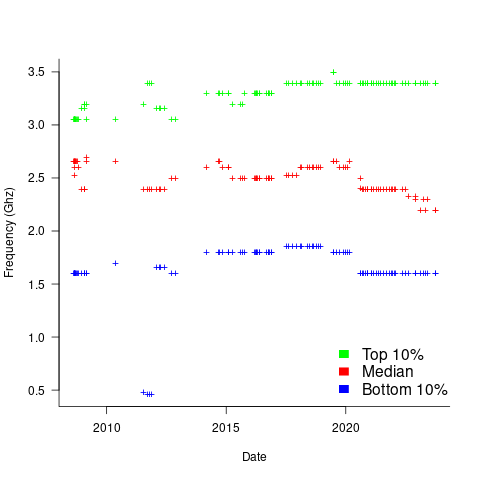
Broadly, the plot shows that cpu frequencies have essentially remained unchanged since 2008, with systems running BSD having a median frequency of 2.5 GHz, with 10% of systems having a frequency over 3.5 GHz, and 10% of systems a frequency below 1.5 GHz.
I was surprised at how many different frequencies were present in the data; often over 50. A look at the large number of different versions of Intel x86 cpus suggests that this is to be expected.
How representative is this sample of BSD systems, compared to the many more systems running Linux and Windows?
This begs the question of what kinds of environments are being compared. Are these desktop systems, local or hosted clusters, cloud systems?
The plot below shows the total number of cpus summarised on each Wayback Machine snapshot (code+data):

A few thousand systems are likely to be personal desktop systems, while the tens of thousands are likely to be clusters or small cloud providers.
Pointers to more data, particularly pre-2000, most welcome.
Recent Comments