Some information on story point estimates for 16 projects
Issues in Jira repositories sometimes include an estimate, in story points, but no information on time to complete (an opening/closing date is usually available; in some projects issues pass through various phases, and enter/exit date/time may be available).
Evidence-based software engineering is a data driven approach to figuring out software development processes. At the practical level, data is usually hard to come by; working with whatever data is available, an analysis may feel like making a prophecy based on examining animal entrails.
Can anything be learned from project issue data that just contains story point estimates? Let’s go on a fishing expedition.
My software data collection includes a paper that collected 23,313 story point estimates from 16 projects (the authors tried to predict an estimate, in story points, for an issue based on its description). If nothing else, this data is a sample of what might be encountered in other projects.
Developers estimating with story points often select values from the Fibonacci sequence, while developers estimating using hours/minutes often use round numbers. The granularity of both the Fibonacci values and round numbers follow the same exponential growth pattern. In terms of granularity, estimating story points in Fibonacci values need not far removed from estimating time in round numbers.
The number of story points per project varied from 352 to 4,667, with a mean of 1,457.
The plots below show the number of issues (y-axis, normalised across projects) estimated to require a given number of story points (x-axis), for 16 projects, with projects clustered by peak story point value (i.e., a project’s most frequently used story point value; code+data):
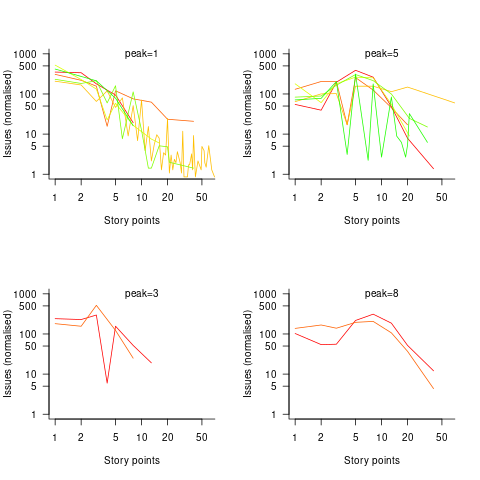
Are the projects with estimate peaks at 3 and 8 story points a quirk of this dataset, or is it to be expected that around 10% of projects will peak at one of these values?
For me, what jumps out of these plots is the number and extent of 4 story point estimates. Perhaps it’s just a visual effect, the actual number is an order of magnitude less than for 3 and 5 story points.
The plot below shows the percentage of estimated story points that are not Fibonacci numbers, sorted by project (the one project not showing has 0%; code+data):

If nothing else, these plots provide a base to start from, and potentially claim to have seen this pattern before.
I’m pretty familiar with these values, having run a v. large Jira instance for some time. Story points are supposed to just be there to help a team plan their next sprint. But because they are numbers they often become a convenient metric for a team’s performance. So there is a tendency to inflate the values over time, I think. Also, the conversion to a number of hours or days varies from one team to another. The use of Fibonacci numbers seem to be not as common in practice as it once was, in my experience.
Getting teams to record the actual time spent on any activity is notoriously difficult, so the lack of that data is not surprising to me. But this is still interesting. The day of creating an issue is another odd piece of data, generally towards the beginning of the work week.
Also, it’s Jira not JIRA. Atlassian “renamed” their product a few years ago. I know, I know.
@Matt Doar
One way to look at story points is as a psychologically safe way of getting developers to estimate, with estimates treated as a way of getting developers to put some effort into thinking about the issue, and potentially subdividing it when the number turns out to be large.
That’s an interesting observation about use of Fibonacci numbers. Does individual usage decline over time, or is it a cultural shift. An idea to keep in mind for newly discovered data.
There are companies that record actual time, the problem is that most of them I encounter are large (i.e., have lawyers). The few small ones are gold dust. But the trouble with small companies is that they already know most of what a data analysis tells them.
Thanks for the typography reminder, old habits die hard. Fixed.