Archive
Some information on story point estimates for 16 projects
Issues in Jira repositories sometimes include an estimate, in story points, but no information on time to complete (an opening/closing date is usually available; in some projects issues pass through various phases, and enter/exit date/time may be available).
Evidence-based software engineering is a data driven approach to figuring out software development processes. At the practical level, data is usually hard to come by; working with whatever data is available, an analysis may feel like making a prophecy based on examining animal entrails.
Can anything be learned from project issue data that just contains story point estimates? Let’s go on a fishing expedition.
My software data collection includes a paper that collected 23,313 story point estimates from 16 projects (the authors tried to predict an estimate, in story points, for an issue based on its description). If nothing else, this data is a sample of what might be encountered in other projects.
Developers estimating with story points often select values from the Fibonacci sequence, while developers estimating using hours/minutes often use round numbers. The granularity of both the Fibonacci values and round numbers follow the same exponential growth pattern. In terms of granularity, estimating story points in Fibonacci values need not far removed from estimating time in round numbers.
The number of story points per project varied from 352 to 4,667, with a mean of 1,457.
The plots below show the number of issues (y-axis, normalised across projects) estimated to require a given number of story points (x-axis), for 16 projects, with projects clustered by peak story point value (i.e., a project’s most frequently used story point value; code+data):
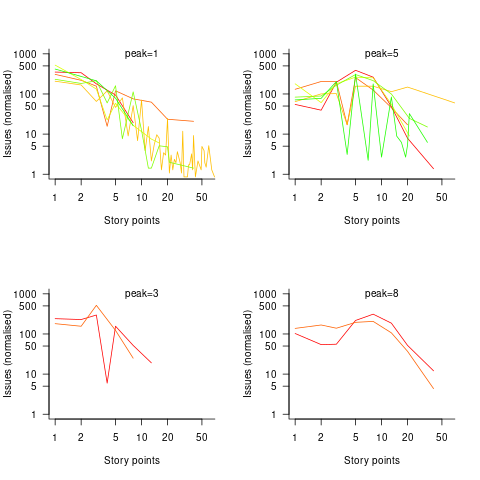
Are the projects with estimate peaks at 3 and 8 story points a quirk of this dataset, or is it to be expected that around 10% of projects will peak at one of these values?
For me, what jumps out of these plots is the number and extent of 4 story point estimates. Perhaps it’s just a visual effect, the actual number is an order of magnitude less than for 3 and 5 story points.
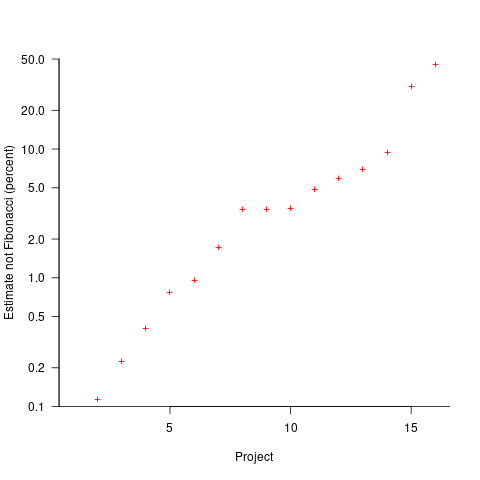
The plot below shows the percentage of estimated story points that are not Fibonacci numbers, sorted by project (the one project not showing has 0%; code+data):
If nothing else, these plots provide a base to start from, and potentially claim to have seen this pattern before.
Patterns in the LSST:DM Sprint/Story-point/Story ‘done’ issues
Projects that use Scrum as their project management framework estimate tasks (known as a user story, or just story) in units of Story-points. A collection of User stories are grouped together to be implemented during a Sprint (a time-boxed interval, often lasting 2-weeks).
What are Story-points, and how do they map to time (in hours and minutes)? For this post, let’s ignore these questions, simply assuming that the people who assign a story-point value to a story have some mapping in their head.
What is the average number of story-points in a story, and how does this average vary across teams? What is the distribution of number of stories estimated per sprint, how many are actually implemented, and how does this vary across teams?
The data required to answer these questions has not been publicly available, or rather public data is not known to me. Until this week, I had only known of a few public Jira repos where story-points were given for at most a few hundred stories.
The LSST Corporation, a not-for-profit involved in astronomy and physics research, has a Data Management (DM) project. The Jira repo for this project contains 26,671 ‘Done’ issues (as of Aug 2022), of which 11,082 (41.5%) have assigned story-points; there have been 469 sprints, which involved 33% of the issues. The start/end implementation date/time for stories is mostly rather granular, and not fine enough to be used to attempt to correlate individual stories with hours. I found this repo, and a couple of others, via the paper Story points changes in agile iterative development, and downloaded all available issues.
What patterns are present in the story-point and sprint data?
Story points are commonly thought of as being integer valued, but 28% of the values are non-integer. If any developers are using the Fibonacci scale, there are not enough to have a noticeable impact. The plot below shows the number of stories estimated to involve a given number of story-points (black pluses are non-integer values, which have been rounded to fit the regression model). The green curved line is a fitted biexponential (sum of two exponentials), with the two straight lines being the two component exponentials (code+data):
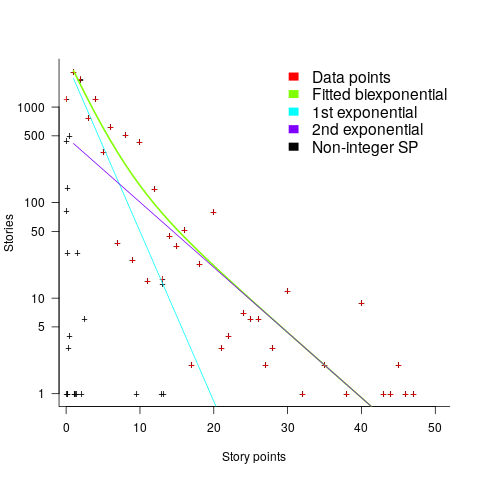
One exponential is dominant for stories assigned up to 10 story-points, and the second exponential for higher story-point values.
The development team decides to implement a story and allocates it to a sprint. A story may be reallocated to another sprint before the start of the original sprint, or after the sprint is finished when its implementation is incomplete or not yet started (the data does not allow for these cases to be distinguished). How many sprints is a story allocated to, before the story implementation is complete?
The plot below shows the number of stories allocated to a given number of sprints, with a fitted regression line of the form  (code+data):
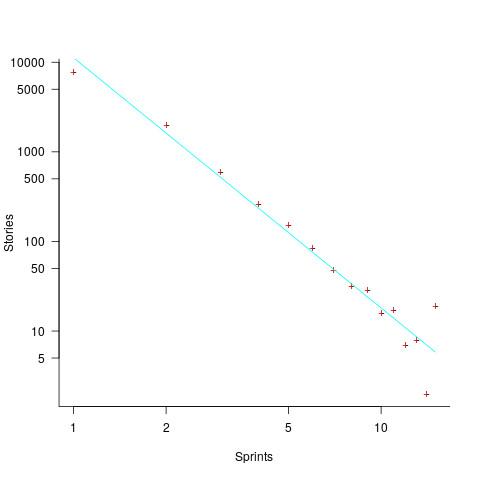
So around 14% of stories are allocated to two sprints, 5% to three and 2% to four.
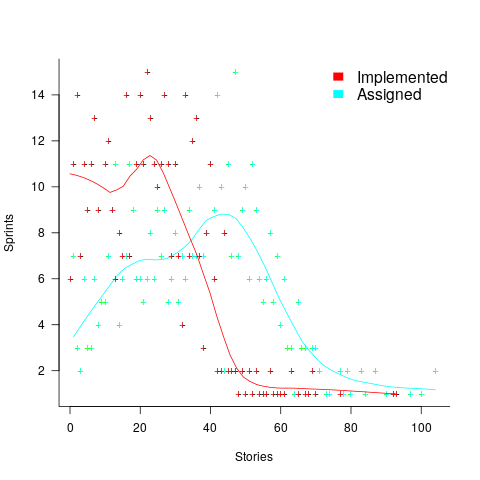
How many stories are assigned to a sprint? The plot below shows the number of sprints having a given number of stories assigned to them, and the number of sprints implementing a given number of stories; lines are fitted loess models (code+data):
Are the Story/Story-point/Sprint patterns found in the DM project likely to occur in other projects using Scrum?
I don’t know, but I hope so. Developing theories of software development processes requires that there be consistent patterns of behavior.
Not knowing what stories were assigned to a sprint at the start of the sprint, rather assigned earlier and then moved to another sprint, potentially undermines the sprint patterns. We will have to wait and see.
If anybody knows of any public Jira repos where a high percentage (say 40%) of the issues have been assigned story-points, please let me know (all the ones I know of on the Atlassian site contain a tiny percentage of story-points).
Recent Comments