Archive
Software task estimation using LLMs is fake research
Developers hate having to provide an estimate for the time needed to implement some functionality. Given the extent to which LLMs have become embedded in the software world, offloading the estimation question to an LLM appears to be an obvious solution.
The problem is that LLMs are very unlikely to give a meaningful answer. However, given that 33% of human estimates are accurate (for tasks of a few hours), 66% within a factor of two (over or under), and 95% within a factor of four (over or under), the accuracy bar for LLMs is low.
Given enough training data, LLMs can do amazing things, e.g., help solve difficult maths problems. LLMs often being good-enough at producing source code is dependent on them having been trained on huge amounts of source code.
The miniscule amount of publicly available software task estimation data is orders of magnitude smaller than the quantity needed to effectively fine-tune a software oriented LLM. Estimation training data needs to contain the following information:
- an appropriately detailed description of the problem,
- the source code of the program being updated, as it existed prior to this or any later features being added (similar descriptions may involve different implementation activities on different projects),
- the actual implementation time,
- a summary of the skill set of the developers who did the work (a developer familiar with the source is likely to complete a task faster than a developer new to the project).
There are datasets (here {10K rows} and here {62K rows}) that contain items (1) and (3).
There are datasets (e.g., here {37K rows} and here {23K rows}) that contain (1) for Open source projects, so (2) could be obtained. These datasets contain estimates (usually in Story Points), and a handful of recorded actuals (and often a status change date-time for each issue, which might/perhaps/maybe used as a proxy for actual work time).
Estimation data (in story points, function points, or time) is much more common than Actual (when available, usually time). Needless to say, there are papers (e.g., here and here) that use human estimation data for training, and then measure LLM performance on close it comes to the human estimates, not the actuals.
My 2024 summary of what is known about task estimation did not discuss the impact of LLMs. What was known is 2024 is that several human factors (e.g., use of round numbers and individual risk profile) play a major role in task estimation. LLMs may reduce the time needed for some tasks, but the human factors remain.
The use of round numbers is deeply embedded in the brain. I suspect the impact of LLM usage will not be to reduce implementation time estimates for tasks, but to increase the amount of functionality included in a task to match the established round number times of 1,2,4 and 7 hours.
Users of story points have the option of leaving everything unchanged. However, there are users of story points who equate one story point to one hour. Will the amount of task functionality be increased to maintain this equating?
Users of function points can continue to count them in the same way. What changes, in an LLM world, is the cost of implementing a function point. Given that the method of calculating the number of function points is specified in various national/international standards, it is not possible to simply increase the amount of functionality to maintain the existing price of a function point.
To summarise: LLMs are being trained on small datasets that don’t contain all the required information to give responses that mimic human estimates made in a pre-LLM world.
One of my most popular blog posts is: Software effort estimation is mostly fake research. The adverb “mostly” can be dropped once LLMs are involved.
Repo of software estimation datasets
I have finally gotten around to creating a GitHub repository for the publicly available software estimation datasets. My reasons for doing this include increasing the visibility of the large datasets, having something to reference when I tell people about the miniscule size of most of the datasets modeled in research papers (one of my most popular posts explains why software estimation is mostly fake research), and to help me remember what datasets I do have.
There is a huge disparity in dataset sizes. The main reason for this is that some datasets contain one row for each task within a project, while others contain one row for the whole project.
The Albrecht dataset from 1983 contains 24 rows, and I’m treating it as the minimum size for a dataset to be included in this repo. Smaller datasets have been published, but I don’t see any value including them. Albrecht is only included because it is used by earlier papers.
The current state of knowledge about the characteristics of individual task estimates is discussed in an earlier post.
What of the row per project datasets? Other than overestimates being common, there is not enough data to reliably spot/claim recurring project patterns across datasets. The estimates have probably occurred in a competitive environment, i.e., there is an incentive to bid low. The common techniques used to estimate projects are either based on counting Function points, or on estimating the number of lines of code contained in the delivered system (this value, plus other values, is plugged in to a cost estimation model, e.g., COCOMO).
The problem with estimating using LOC (which is itself estimated) is that there can be large differences in the number of LOC written by different developers to implement the same functionality.
The datasets in the initial upload include those that are commonly cited in research papers, and those analysed on this blog. I will probably discover (i.e., remember) more datasets in the coming weeks, as happened for the repository of reliability datasets created a few months ago.
Some information on story point estimates for 16 projects
Issues in Jira repositories sometimes include an estimate, in story points, but no information on time to complete (an opening/closing date is usually available; in some projects issues pass through various phases, and enter/exit date/time may be available).
Evidence-based software engineering is a data driven approach to figuring out software development processes. At the practical level, data is usually hard to come by; working with whatever data is available, an analysis may feel like making a prophecy based on examining animal entrails.
Can anything be learned from project issue data that just contains story point estimates? Let’s go on a fishing expedition.
My software data collection includes a paper that collected 23,313 story point estimates from 16 projects (the authors tried to predict an estimate, in story points, for an issue based on its description). If nothing else, this data is a sample of what might be encountered in other projects.
Developers estimating with story points often select values from the Fibonacci sequence, while developers estimating using hours/minutes often use round numbers. The granularity of both the Fibonacci values and round numbers follow the same exponential growth pattern. In terms of granularity, estimating story points in Fibonacci values need not far removed from estimating time in round numbers.
The number of story points per project varied from 352 to 4,667, with a mean of 1,457.
The plots below show the number of issues (y-axis, normalised across projects) estimated to require a given number of story points (x-axis), for 16 projects, with projects clustered by peak story point value (i.e., a project’s most frequently used story point value; code+data):
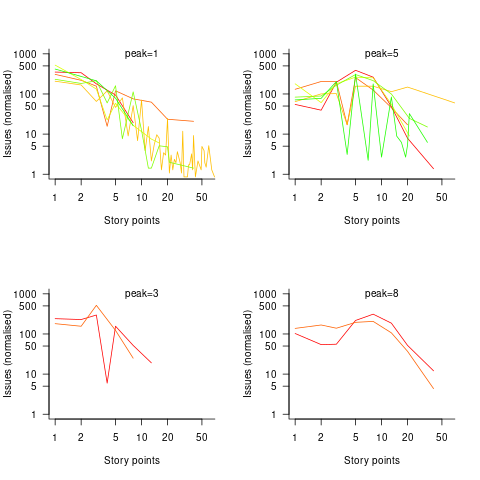
Are the projects with estimate peaks at 3 and 8 story points a quirk of this dataset, or is it to be expected that around 10% of projects will peak at one of these values?
For me, what jumps out of these plots is the number and extent of 4 story point estimates. Perhaps it’s just a visual effect, the actual number is an order of magnitude less than for 3 and 5 story points.
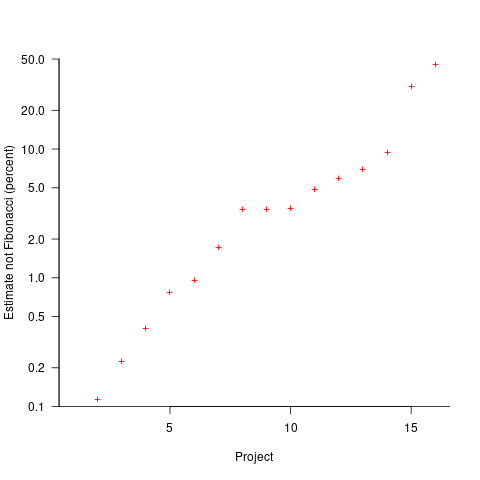
The plot below shows the percentage of estimated story points that are not Fibonacci numbers, sorted by project (the one project not showing has 0%; code+data):
If nothing else, these plots provide a base to start from, and potentially claim to have seen this pattern before.
How much productive work does a developer do?
Measuring develop productivity is a nightmare issue that I do my best to avoid.
Study after study has found that workers organise their work to suit themselves. Why should software developers be any different?
Studies of worker performance invariably find that the rate of work is higher when workers are being watched by researchers/managers; this behavior is known as the Hawthorne effect. These studies invariably involve some form of production line work involving repetitive activities. Time is a performance metric that is easy to measure for repetitive activities, and directly relatable to management interests.
A study by Bernstein found that production line workers slowed down when observed by management. On the production line studied, it was not possible to get the work done in the allotted time using the management prescribed techniques, so workers found more efficient techniques that were used when management were not watching.
I have worked on projects where senior management decreed that development was to be done according to some latest project management technique. Developers quickly found that the decreed technique was preventing work being completed on time, so ignored it while keeping up a facade to keep management happy (who appeared to be well aware of what was going on). Other developers have told me of similar experiences.
Studies of software developer performance often implicitly assume that whatever the workers (i.e., developers) say must be so; there is no thought given to the possibility that the workers are promoting work processes that suits their interests and not managements.
Just like workers in other industries, software developers can be lazy, lack interest in doing a good job, unprofessional, a slacker, etc.
Hard-working, diligent developers can be just as likely as the slackers, to organise work to suit themselves. A good example of this is adding product features that the developer wants to add, rather than features that the customer wants to use, or working on features/performance that exceed the original requirements (known as gold plating in other industries).
Developers will lobby for projects to use the latest language/package/GUI/tools in their work. While issues around customer/employer cost/benefit might be cited as a consideration, evidence, in the form of a cost/benefit analysis, is not usually given.
Like most people, developers want others to have a good opinion of them. As writers, of code, developers can attach a lot of weight to how its quality will be perceived by other developer. One consequence of this is a willingness to regularly spend time polishing good-enough code. An economic cost/benefit of refactoring is rarely a consideration.
The first step of finding out if developers are doing productive work is finding out what they are doing, or even better, planning in some detail what they should be doing.
Developers are not alone in disliking having their activities constrained by detailed plans. Detailed plans imply some form of estimates, and people really hate making estimates.
My view of the rationale for estimating in story points (i.e., monopoly money) is that they relieve the major developer pushback on estimating, while allowing management to continue to create short-term (e.g., two weeks) plans. The assumption made is that the existence of detailed plans reduces worker wiggle-room for engaging in self-interest work.
Small team estimating in story points; a project dataset
Just before the end of last year a regular reader, Mr A., emailed to ask if I would be interested in analysing the software project data for the company he worked for. The wishing to be anonymous company sold physical products, and bespoke software that supported the business was written by a team of three.
Two factors made this dataset interesting, 1) it was for a small team, 2) story points were used for estimating tasks and actual time was recorded (I had not seen such data before).
There are probably hundreds of thousands of small software teams working in companies whose main line of business is far removed from software (a significant percentage of developers work within a small team supporting the activities of non-software companies; I cannot find the bls page listing developer employment across industry codes). These small teams are rarely studied. Software engineering research usually focuses on the practices of software based companies, or large software development projects, i.e., groups likely to be easily visible to external researchers.
To be widely applicable, evidence-based software engineering has to be of practical use to small development teams, not just large development groups.
The wide variety of opinions on the accuracy of story point estimates are unsupported by data; at least I have not yet been able to find any. Here was an opportunity to analyse story point estimates against actual hours.
The reason for analysing task implementation data is to help those involved understand what is going on, with the intent of improving processes. A small team presents two major challenges:
- relatively high levels of variability in the data. When there are only a few people working on a project, the impact of individual events can have a dramatic impact on project metrics, e.g., somebody going on holiday results in a big drop in work performed. Statistical analysis looks for general patterns in data, and small sample sizes have a higher variance than large sample sizes. With a large team, the impact of individual events tends to be smoothed out by the activities of many other events,
- the project lead of a small team is likely to have a good understanding of what is going on. Mr A. was always able to give me detailed explanations behind the patterns I found in the data. There is a lot more going on in a large team, and the team lead is unlikely to have a detailed understanding of everything.
The dataset contained some of the usual patterns found in other datasets (code+data):
- Round numbers. Actual task time finishing on 15/10/30/20 minute boundaries. With stories estimated at between one and five story points, there was little scope for round number use here.
- Consistent under/over estimation. A small sample size limited the chances of seeing both under and over estimation, and only under estimation was seen.
- Estimation accuracy. The factor of two/four accuracy pattern seen is close to that seen in data from other companies.
What did I learn from the analysis of this dataset?
I was pleased to see that the multiplication factors around estimation accuracy were similar to those seen with time-based estimates. I had no feel for how estimation accuracy might compare. We will have to wait and see whether the same pattern is found in other projects using story point estimates.
The analysis conversation for other project datasets had involved exchange of emails. Updating a Markdown formatted project analysis file has proved to be a more usable approach for the conversation between me and the domain expert. I used Visual Studio Code to edit this file and generate a pdf.
I asked Mr A. what would he thought was the most useful part of the analysis, for him.
Mr A. “The most useful part of the analysis? I think it was great to get an outsider’s perspective on the data.”
I hope that this dataset is the first of many from small team projects. With enough experience, it ought to be possible to create a template spreadsheet/markdown file that is generally usable for non-experts.
Evaluating Story point estimation error
If a task implementation estimate is expressed in time, various formula are available for evaluating how well the estimated time corresponds to the actual time.
When an estimate is expressed in story points, how might the estimate be evaluated when actual time is measured in hours?
The common practice of selecting story point values from a small set of integers (I have seen fractional values used) introduces quantization error into most estimates (around 30% of time estimates equal actual time), assuming that actual times are not constrained to a similar number of possible time values.
If we assume a linear mapping from estimated story points to actual time and an ideal estimator (let’s assume that 1 story point is equivalent to 1 hour), then a lower bound on the error can be calculated.
Our ideal estimator is able to exactly predict the actual time. However, the use of story points means that this exact prediction has to be rounded to one of a small set of integer values. Let’s assume that our ideal estimator rounds to the story point value that is closest to the exact prediction, e.g., all story points predicted to take up to 1.5 are estimated at 1 story point.
What is the mean error of the estimates made by this ideal, rounded, estimator?
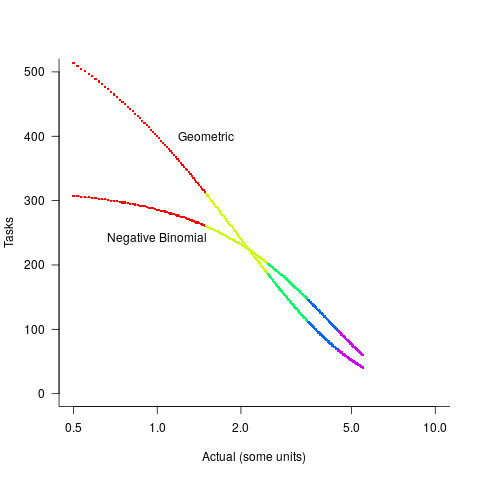
The available evidence shows that the distribution of tasks having a given actual implementation time roughly has the form of a geometric (the discrete form of exponential) or negative binomial distribution. The plot below shows a geometric and negative binomial distribution, with distinct colors over the range where values are rounded to the same closest integer (dots are at 1-minute intervals, code):
Having picked a distribution for actual times, we can calculate the number of tasks estimated to require, for instance, 1 story point, but actually taking 1 hour, 1 hr 1 min, 1 hr 2 min, …, 1 hr 30 min. The mean error can be calculated over each pair of estimate/actual, for one to five story points (in this example). The table below lists the mean error for two actual distributions, calculated using four common metrics: squared error (SE), absolute error (AE), absolute percentage error (APE), and relative error (RE); code:
Distribution SE AE APE RE Geometric 0.087 0.26 0.17 0.20 Negative Binomial 0.086 0.25 0.14 0.16 |
A few minutes difference in a 1 SP estimate is a larger error than the same number of minutes in a two or more SP estimate, combined with most tasks take a small amount of time, means that error estimation is dominated by inaccuracies in estimating small tasks.
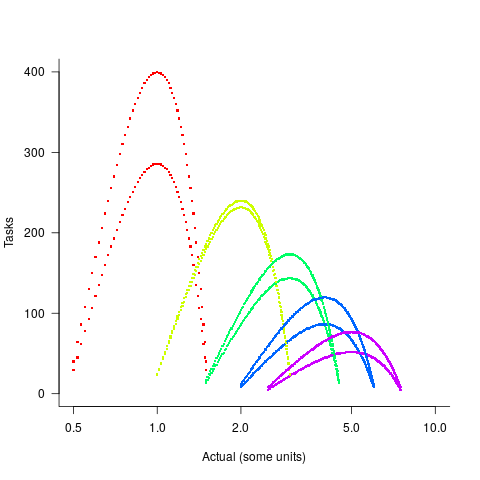
In practice, the range of actual times, for a given estimate, is better approximated by a percentage of the estimated time (50% is used below), and the number of tasks having a given actual value for a given estimate, approximated by a triangular distribution (a cubic equation was used for the following calculation). The plot below shows the distribution of estimation points around a given number of story points (at 1-minute intervals), and the geometric and negative binomial distribution (compare against plot above to work out which is which; code):
The following table lists of mean errors:
Distribution SE AE APE RE Geometric 0.52 0.55 0.13 0.13 Negative Binomial 0.62 0.61 0.13 0.14 |
When the error in the actual is a percentage of the estimate, larger estimates have a much larger impact on absolute accuracy; see the much larger SE and AE values. The impact on the relative accuracy metrics appears to be small.
Is evaluating estimation error useful, when estimates are given in story points?
While it’s possible to argue for and against, the answer is that usefulness is in the eye of the beholder. If development teams find the information useful, then it is useful; otherwise not.
Patterns in the LSST:DM Sprint/Story-point/Story ‘done’ issues
Projects that use Scrum as their project management framework estimate tasks (known as a user story, or just story) in units of Story-points. A collection of User stories are grouped together to be implemented during a Sprint (a time-boxed interval, often lasting 2-weeks).
What are Story-points, and how do they map to time (in hours and minutes)? For this post, let’s ignore these questions, simply assuming that the people who assign a story-point value to a story have some mapping in their head.
What is the average number of story-points in a story, and how does this average vary across teams? What is the distribution of number of stories estimated per sprint, how many are actually implemented, and how does this vary across teams?
The data required to answer these questions has not been publicly available, or rather public data is not known to me. Until this week, I had only known of a few public Jira repos where story-points were given for at most a few hundred stories.
The LSST Corporation, a not-for-profit involved in astronomy and physics research, has a Data Management (DM) project. The Jira repo for this project contains 26,671 ‘Done’ issues (as of Aug 2022), of which 11,082 (41.5%) have assigned story-points; there have been 469 sprints, which involved 33% of the issues. The start/end implementation date/time for stories is mostly rather granular, and not fine enough to be used to attempt to correlate individual stories with hours. I found this repo, and a couple of others, via the paper Story points changes in agile iterative development, and downloaded all available issues.
What patterns are present in the story-point and sprint data?
Story points are commonly thought of as being integer valued, but 28% of the values are non-integer. If any developers are using the Fibonacci scale, there are not enough to have a noticeable impact. The plot below shows the number of stories estimated to involve a given number of story-points (black pluses are non-integer values, which have been rounded to fit the regression model). The green curved line is a fitted biexponential (sum of two exponentials), with the two straight lines being the two component exponentials (code+data):
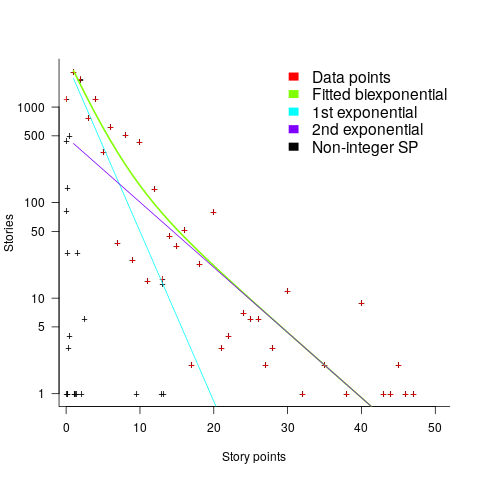
One exponential is dominant for stories assigned up to 10 story-points, and the second exponential for higher story-point values.
The development team decides to implement a story and allocates it to a sprint. A story may be reallocated to another sprint before the start of the original sprint, or after the sprint is finished when its implementation is incomplete or not yet started (the data does not allow for these cases to be distinguished). How many sprints is a story allocated to, before the story implementation is complete?
The plot below shows the number of stories allocated to a given number of sprints, with a fitted regression line of the form  (code+data):
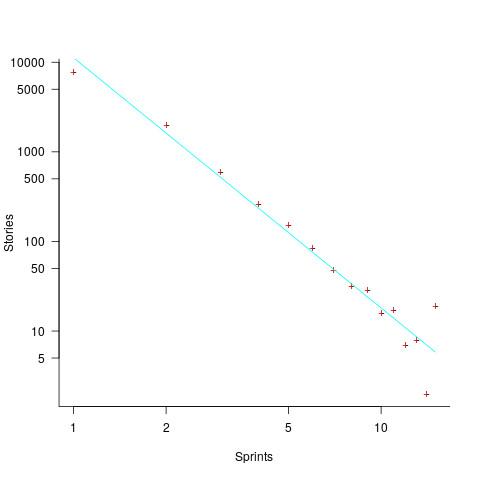
So around 14% of stories are allocated to two sprints, 5% to three and 2% to four.
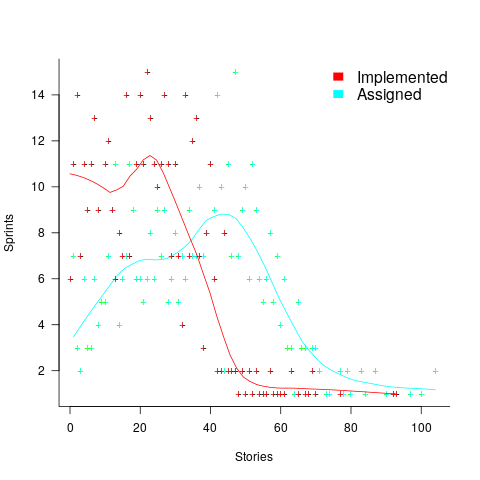
How many stories are assigned to a sprint? The plot below shows the number of sprints having a given number of stories assigned to them, and the number of sprints implementing a given number of stories; lines are fitted loess models (code+data):
Are the Story/Story-point/Sprint patterns found in the DM project likely to occur in other projects using Scrum?
I don’t know, but I hope so. Developing theories of software development processes requires that there be consistent patterns of behavior.
Not knowing what stories were assigned to a sprint at the start of the sprint, rather assigned earlier and then moved to another sprint, potentially undermines the sprint patterns. We will have to wait and see.
If anybody knows of any public Jira repos where a high percentage (say 40%) of the issues have been assigned story-points, please let me know (all the ones I know of on the Atlassian site contain a tiny percentage of story-points).
NoEstimates panders to mismanagement and developer insecurity
Why do so few software development teams regularly attempt to estimate the duration of the feature/task/functionality they are going to implement?
Developers hate giving estimates; estimating is very hard and estimates are often inaccurate (at a minimum making the estimator feel uncomfortable and worse when management treats an estimate as a quotation). The future is uncertain and estimating provides guidance.
Managers tell me that the fear of losing good developers dissuades them from requiring teams to make estimates. Developers have told them that they would leave a company that required them to regularly make estimates.
For most of the last 70 years, demand for software developers has outstripped supply. Consequently, management has to pay a lot more attention to the views of software developers than the views of those employed in most other roles (at least if they want to keep the good developers, i.e., those who will have no problem finding another job).
It is not difficult for developers to get a general idea of how their salary, working conditions and practices compares with other developers in their field/geographic region. They know that estimating is not a common practice, and unless the economy is in recession, finding a new job that does not require estimation could be straight forward.
Management’s demands for estimates has led to the creation of various methods for calculating proxy estimate values, none of which using time as the unit of measure, e.g., Function points and Story points. These methods break the requirements down into smaller units, and subcomponents from these units are used to calculate a value, e.g., the Function point calculation includes items such as number of user inputs and outputs, and number of files.
How accurate are these proxy values, compared to time estimates?
As always, software engineering data is sparse. One analysis of 149 projects found that  , with the variance being similar to that found when time was estimated. An analysis of Function point calculation data found a high degree of consistency in the calculations made by different people (various Function point organizations have certification schemes that require some degree of proficiency to pass).
Managers don’t seem to be interested in comparing estimated Story points against estimated time, preferring instead to track the rate at which Story points are implemented, e.g., velocity, or burndown. There are tiny amounts of data comparing Story points with time and Function points.
The available evidence suggests a relationship connecting Function points to actual time, and that Function points have similar error bounds to time estimates; the lack of data means that Story points are currently just a source of technobabble and number porn for management power-points (send me Story point data to help change this situation).
Recent Comments