Archive
Advertised prices of desktop computers during the 1990s
The 1990s was a decade of dramatic improvements in desktop computer capacity and performance. The difference in performance between the newest and current systems was clearly visible from the rate at which compiler messages zipped up the screen. How did the price of these desktop systems change during this period?
Magazine adverts are sometimes the only publicly available source of information about historical products. For instance, the characteristics of IBM PC compatible computers (e.g., price, RAM, clock frequency) over the first 20 years since they were first introduced in the early 1980s.
During the 1980s and 1990s BYTE magazine was the leading monthly computer magazine in the US, with a strong following here in the UK. Each issue contained around 400+ pages, and was packed with adverts from all the major hardware/software vendors. The last issue appeared in Jul 1998. The Internet Archive contains a scanned copy of every issue.
In 1987 Dell Computer Corp started selling cut-price computers direct to customers. Dell ran adverts in every issue of BYTE from June 1988 until the magazine closed. Gateway was another company in this market, and also regularly advertised in BYTE.
The text information present in adverts is often embedded within graphical content. My interest in this information has not been sufficient to manually type it in. LLMs are now available, and these have proven to be remarkably effective at extracting information from images.
The following advert shows how information specific to a particular computer system appears once, along with prices for particular options. Grok correctly populates a csv file containing information on four systems.
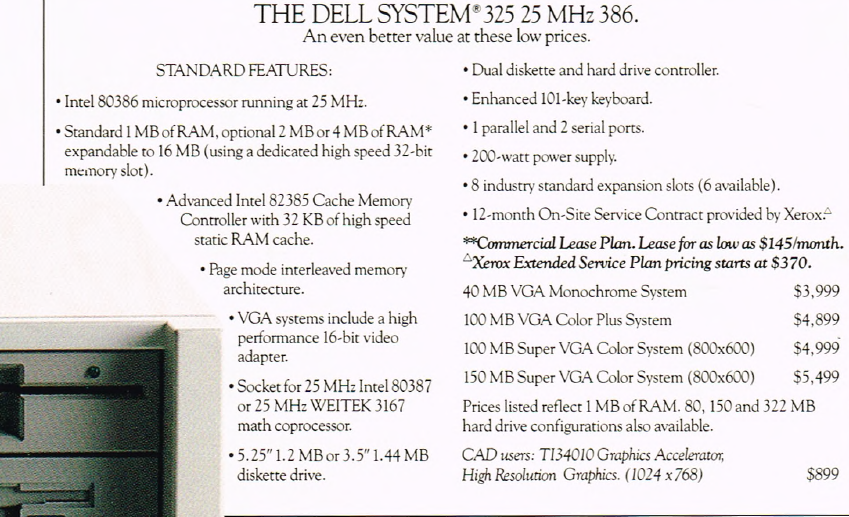
I did not attempt to ask LLMs to extract the Dell/Gateway ads from a 400+ page magazine. Manual extraction of the advert pages also gave me the opportunity to scan for other ads (a few companies advertised sporadically, e.g., Micron). Some experimentation showed that Grok returned the most accurate/reliable data.
System configuration information, for Dell and Gateway, was extracted from their adverts that appeared in the June/December issues for every year between 1988 and 1998.
Adverts show the price of particular system configurations. Typically, vendors list prices for minimal systems, along with the incremental price for more memory or a larger hard disc.
The plot below shows the original US dollar prices of 500 systems appearing in Dell/Gateway/Micron/Zeos BYTE adverts during the 1990s (code+data):
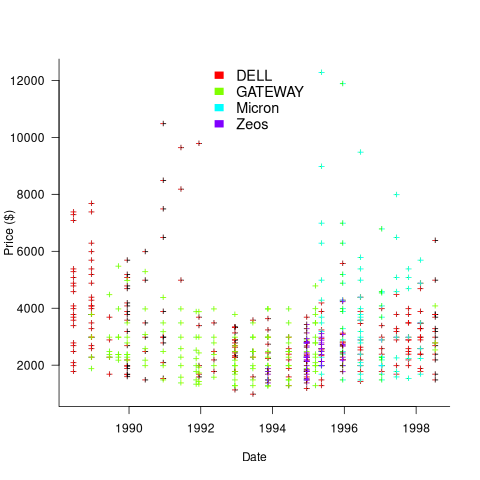
These prices have not been adjusted for inflation, and show the numeric values often ending in “99” that appeared in the adverts.
Once a ballpark figure is established in the market for the price of a product, vendors are loath to decrease it. Higher priced systems generally have higher profit margins.
Dell starts by offering systems whose price varies by a factor of four, and then settles into a narrower range of prices (presumably based on feedback from volume of sales). Micro appears to be similarly experimenting around 1996.
In the UK, when the price of low-end systems reached £1,000, rather than continuing to reduce the price, sales outlets started adding a printer to a complete package, keeping the price at around £1,000 (which families were willing to pay). Eventually the cost of a printer was not enough to fill the price gap.
The plot below shows the advertised disk size and amount of RAM installed in 500 systems advertised during the 1990s (the 1.44MB disk is a floppy drive only system; code+data):

The well-known exponential capacity growth is clearly visible.
The data shows that during the 1990 there was no consistent decrease in the numeric value of the advertised price of desktop computers, which fluctuated (more data is needed to separate out the effects of functionality added to top-end systems), while actual prices decreased by 30% over the decade due to inflation. The capacity of the disk and RAM installed in desktop systems increased exponentially (also cpu clock speed; this plot is not shown).
The Hedonic index is a process used by economists to model the interaction of a product’s price and its characteristics.
Relative performance of computers since the 1990s
What was the range of performance of desktop’ish computers introduced since the 1990s, and what was the annual rate of performance increase (answers for earlier computers)?
Microcomputers based on Intel’s x86 family was decimating most non-niche cpu families by the early 1990s. During this cpu transition a shift to a new benchmark suite followed a few years behind. The SPEC cpu benchmark originated in 1989, followed by a 1992 update, with the 1995 update becoming widely used. Pre-1995 results don’t appear on the SPEC website: “Because SPEC’s processes were paper-based and not electronic back when SPEC CPU 92 was the current benchmark, SPEC does not have any electronic storage of these benchmark results.” Thanks to various groups, some SPEC89/92 results are still available.
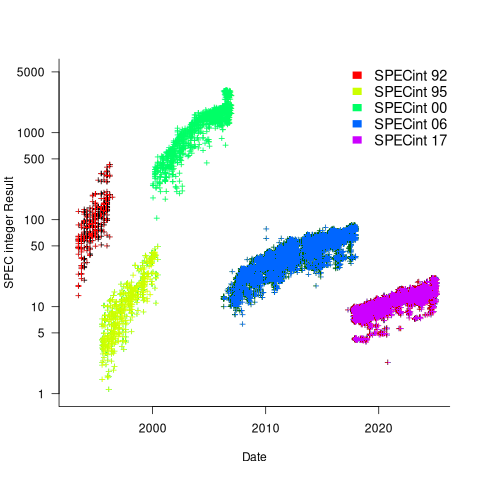
The following analysis uses the results from the SPEC integer benchmarks, which was changed in 1992, 1995, 2000, 2008, and 2017.
Every time a benchmark is changed, the reported results for the same computer change, perhaps by a lot. The plot below shows the results for each version of the benchmark (code+data):
Provide a few conditions are met, it is possible to normalise each set of results, allowing comparisons to be made across benchmark changes. First, results from running, say, both SPEC92 and SPEC95 on some set of computer needs to be available. These paired results can be used to build a model that maps result values from one benchmark to the other. The accuracy of the mapping will depend on there being a consistent pattern of change, i.e., a strong correlation between benchmark results.
The plot below shows the normalised results, along with regression models fitted to each release (code+data):
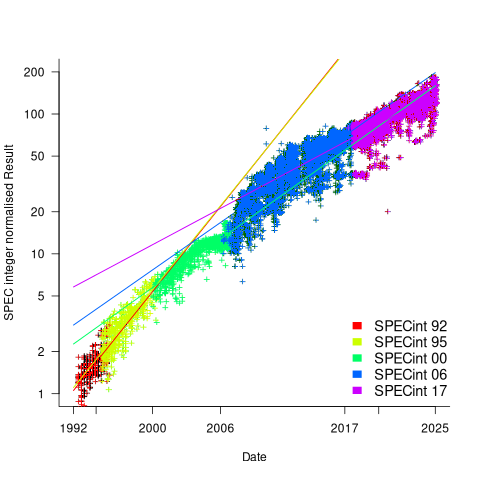
What happened around 2007? Dennard scaling stopped, and there is an obvious meeting of two curves as one epoch transitioned into another. Since 2007 performance improvements have been driven by faster memory, larger caches, and for some applications multiple on-die cpus.
The table below shows the annual growth in SPECint performance for each of the benchmark start years, over their lifetime.
      Year   Annual growth
      1992       26.2%
      1995       25.9%
      2000       14.2%
      2007       13.9%
2017 10.5% |
In 2025, the cpu integer performance of the average desktop system is over 100 times faster than the average 1992 desktop system. With the first factor of 10 improvement in the first 10 years, and the second factor of 10 in the previous 20 years.
Benchmarking desktop PCs circa 1990
Before buying a computer customers want to be confident of choosing the best they can get for the money, and performance has often been a major consideration. Computer benchmark performance results were once widely discussed.
Knight’s analysis of early mainframe performance was widely cited for many years.
Performance on the Byte benchmarks was widely cited before Intel started spending billions on advertising, clock frequency has not always had the brand recognition it has today.
The Byte benchmark was originally designed for Intel x86 processors running Microsoft DOS; The benchmark was introduced in the June 19885 issue, and was written in the still relatively new C language (earlier microprocessor benchmarks were often written in BASIC, because early micros often came with a free BASIC interpreter), it was updated in the 1990s to be Windows based, and implemented for Unix.
Benchmarking computers using essentially the same cpu architecture and operating system removes many complications that have to be addressed when these differ. Before Wintel wiped them out, computers from different manufacturers (and often the same manufacturer) contained completely different cpu architectures, ran different operating systems, and compilers were usually created in-house by the manufacturer (or some university who got a large discount on their computer purchase).
The Fall 1990 issue of Byte contains tables of benchmark results from 1988-90. What can we learn from these results?
The most important takeaway from the tables is that those performing the benchmarks appreciated the importance of measuring hardware performance using the applications that customers are likely to be running on their computer, e.g., word processors, spreadsheets, databases, scientific calculations (computers were still sufficiently niche back then that scientific users were a non-trivial percentage of the market), and compiling (hackers were a large percentage of Byte’s readership).
The C benchmarks attempted to measure CPU, FPU (built-in hardware support for floating-point arrived with the 486 in April 1989, prior to that it was an add-on chip that required spending more money), Disk and Video (at the time support for color was becoming mainstream, but bundled hardware graphics support still tended to be minimal).
Running the application benchmarks takes a lot of time, plus the necessary software (which takes time to install from floppies, the distribution technology of the day). Running the C benchmarks is much quicker and simpler.
Ideally the C benchmarks are a reliable stand-in for the application benchmarks (meaning that only the C benchmarks need be run).
Let’s fit some regression models to the measurements of the 61 systems benchmarked, all supporting hardware floating-point (code+data). Surprisingly there is no mention of such an exercise being done by the Byte staff, even though one of the scientific benchmarks included regression fitting.
The following fitted equations explain around 90% of the variance of the data, i.e., they are good fits.

For word-processing, the CPU benchmark explains around twice as much as the Disk benchmark.

For spreadsheets, CPU and Disk contribute about the same.

Database is nearly all Disk.
+0.45*CPU*Disk")
Scientific/Engineering is FPU, plus interactions with other components.
+0.33*Disk*Video")
Compiling is CPU, plus interactions with other components.
Byte’s benchmark reports were great eye candy, and readers probably took away a rough feel for the performance of various systems. Perhaps somebody at the time also fitted regression models to the data. The magazine contained plenty of adverts for software to do this.
Recent Comments