Archive
Detailed management data on 1,211 software projects
Until April this year there were only two non-trivial publicly available software project datasets (i.e., Sip and CESAW) containing software project data relating to human effort, e.g., people time, elapsed time, and tasks performed. The SiP data contains 10-years of software development tasks by one company, and the CESAW data contains the tasks involved in implementing 45 software projects.
Two months ago the Software Excellence Alliance released the SEA Data Warehouse (the CESAW data is roughly a 10% subset of SEA). This post compares software project size from the perspective of various management related features.
An analysis of pre-LLM project development is still relevant because many project behavior patterns are driven by interactions with the outside world. Also, time spent writing code is often small part of project development.
The headline summary is that there is development-phase/estimates/actuals/start-time/end-time/person/team/etc information for the 679,904 tasks involved in implementing 1,211 software projects.
The projects were developed using the Team Software Process (TSP). This is an iterative development process that uses development phases similar to the Waterfall process, with weekly meeting that monitor progress using earned-value management. Given that the work-breakdown structure (WBS) is used to break down a project into a hierarchy of smaller and smaller components, these projects are US Department of Defense related.
The plot below shows, for each of the 1,211 projects (sorted by number of plans, in black), the number of tasks (blue), WBS (green), and deleted plans (red) ( ; code+data):
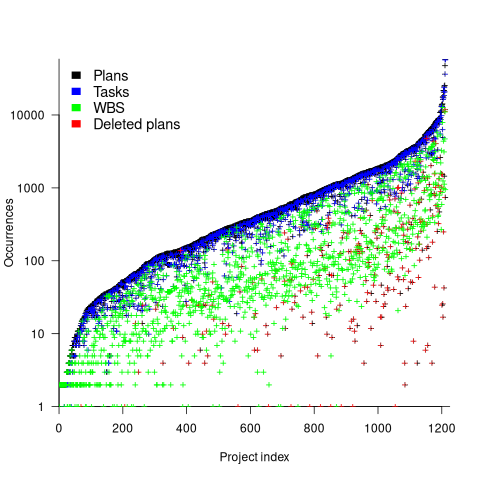
The average ratio of  is 8.4 (standard deviation 23). An exponential or power law (not Weibull) can be fitted to portions of the distribution of project sizes, measured in number of plans or tasks. If project size really does follow a single common distribution, a much larger sample size will be needed to reliably fit it.
The plot below shows, for each project (sorted by total person hours, in red), the number of elapsed days from start of first to end of last task (green), and number of people who worked on at least one task (blue) (projects implemented by a single person do not have consistent time data; code+data):
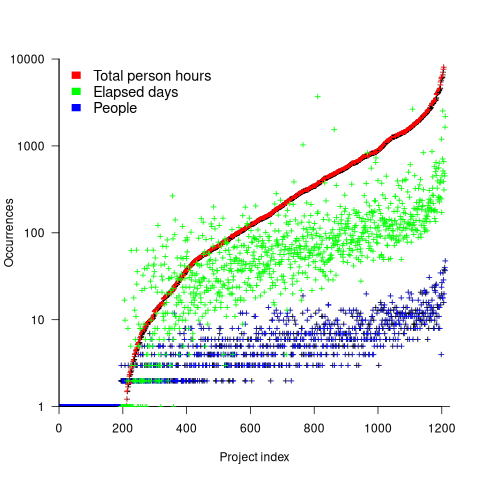
For a given number of person hours worked on a project, there is an order of magnitude variation in elapsed days and number of people who worked on at least one task.
This dataset contains a huge amount of detail, and I’m sure there are lots of patterns to be found. But, what are the important questions to ask, that would be useful to project managers. When I ask managers what project questions they would like answers, the response is often one of quizzical uncertainty. There are plenty of people promoting their opinions, and it’s very rare to encounter anybody asking meaningful questions.
Chinese research in software engineering
China and the Future of Science is the title of a recent article on the blog The Scholar’s Stage. In a series of posts the author, Tanner Greer, has been discussing how Chairman Xi and the Chinese central committee have reoriented the party towards a new goal. In 2026, the aim of China’s communist enterprise is to lead humanity through what they call “the next round of techno scientific revolution and industrial transformation.”.
The Chinese view is that: the first industrial revolution happened in Britain, which was the most powerful country of the 19th century; the second and third (computers) industrial revolutions happened in the USA, which was the most powerful country of the 20th century; the fourth industrial revolution is going to happen in China, which is going to be the most powerful country of the 21st century.
This is a software engineering blog, so I will leave the discussion of any fourth industrial revolution and whether China will lead it to others.
One practical consequence of the Chinese central committee’s focus is lots of funding for science/engineering research, and Chinese academics incentivised to do world-class work. How do you measure an individual’s or institution’s research performance? The Chinese have adopted the Western metric, i.e., counting papers published (weighted by journal impact factor) and number of citations. In 2025, eight of the top ten universities in the CWTS Leiden Ranking are Chinese, with the top western university in the number three spot and the other appearing at number ten. In 2005, six of the top ten universities were in the US.
In a post reviewing software engineering in 2023, I said: “it was very noticeable that many of the authors of papers at major conferences had Asian names. I would say that, on average, papers with Asian author names were better than papers by authors with non-Asian names.”
If software engineering researchers in China are publishing highly cited papers, why am I not seeing blog posts discussing them or hearing people talk about them? The answer is the same for Chinese and Western papers, i.e., little or no industrial relevance (when I point this out to academics they tell me that their work will be found to be relevant in years to come; ha ha {at least in software engineering}).
I label much of the research in software engineering as butterfly-collecting, in the sense that project source code is collected (often via GitHub) and various characteristics are measured and discussed. Much like the biological world was studied 200 years ago. There is no over arching theory, or attempt to model the relationships between different collections.
The incentives have pushed Chinese researchers, in software engineering, to become better butterfly collectors than Western researchers. Also, like Western researchers, they are mostly analysing the data using pre-computer statistical techniques.
If the aim is to publish papers and attract citations, it makes sense for Chinese researchers to study the same topics as Western researchers and analyse the data using the same (pre-computer) statistical techniques. Papers are more likely to be accepted for publication by Westerner reviewers when the subject matter is familiar to those reviewers. There are many tales of researchers having problems publishing papers that introduce new ideas and techniques.
The Central committee don’t just want to appear to be leading the world in engineering research, they want the Chinese to be making the discoveries that enable China to be the most powerful country in the world. For software engineering this means some Chinese researchers must stop following the research agenda set by their Western counterparts, and start asking “what are the important problems in software engineering“, and then researching those problems. If they are effective, a few will be enough.
My Evidence-based Software Engineering book lists and organises some of possible questions to ask, and also contains examples of modern statistical analysis.
China has lots of very good researchers. Perhaps they have all been sucked into the mania vortex around LLMs, and we will have to wait for things to subside. Remember, major discoveries are often made by small group of people.
Positive and negative descriptions of numeric data
Effective human communication is based on the cooperative principle, i.e., listeners and speakers act cooperatively and mutually accept one another to be understood in a particular way. However, when seeking to present a particular point of view, speakers may prefer to be economical with the truth.
To attract citations and funding, researchers sell their work via the papers they publish (or blogs they write), and what they write is not subject to the Advertising Standards Authority rule that “no marketing communication should mislead, or be likely to mislead, by inaccuracy, ambiguity, exaggeration, omission or otherwise” (my default example).
When people are being economical with the truth, when reporting numeric information, are certain phrases or words more likely to be used?
The paper: Strategic use of English quantifiers in the reporting of quantitative information by Silva, Lorson, Franke, Cummins and Winter, suggests some possibilities.
In an experiment, subjects saw the exam results of five fictitious students and had to describe the results in either a positive or negative way. They were given a fixed sentence and had to fill in the gaps by selecting one of the listed words; as in the following:
             all                      all
             most                     most                  right
In this exam .... of the students got .... of the questions .....
             some                     some                  wrong
none none |
If you were shown exam results with 2 out of 5 students failing 80% of questions and the other 3 out of 5 passing 80% of questions, what positive description would you use, and what negative description would you use?
The 60 subjects each saw 20 different sets of exam results for five fictitious students. The selection of positive/negative description was random for each question/subject.
The results found that when asked to give a positive description, most responses focused on questions that were right, and when asked to give a negative description, most responses focused on questions that were wrong
How many questions need to be answered correctly before most can be said to be correct? One study found that at least 50% is needed.
“3 out of 5 passing 80%” could be described as “… most of the students got most of the questions right.”, and “2 out of 5 students failing 80%” could be described as “… some of the students got most of the questions wrong.”
The authors fitted a Bayesian linear mixed effect models, which showed a somewhat complicated collection of connections between quantifier use and exam results. The plots below provide a visual comparison of the combination of quantifier use for positive (upper) and negative (lower) descriptions.
The alluvial plot below shows the percentage flow, for Positive descriptions, of each selected quantifier through student and question, and then adjective (code+data):

For the same distribution of exam results, the alluvial plot below shows the percentage flow, for Negative descriptions, of each selected quantifier through student and question, and then adjective (code+date):
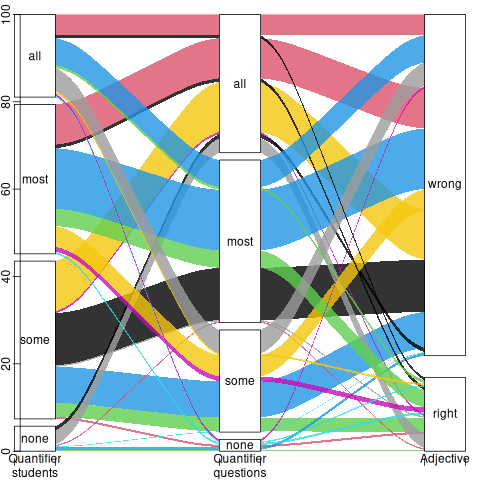
Other adjectives could be used to describe the results (e.g., few, several, many, not many, not all), and we will have to wait for the follow-up research to this 2024 paper.
Number of parameters vs. accessing globals
I spend a lot of time looking at software engineering data, asking, what is the story here?
In a previous post I suggested that the distribution of the number of functions defined to have a given number of parameters, might be a signature of developer beliefs about the relative cost of parameter passing vs accessing globals.
Looking at the data that Iran Rodrigues Gonzaga Junior made available (good man), as part of his thesis Empirical Studies on Fine-Grained Feature Dependencies, I saw it contained information about the number of parameters in a function definition and whether functions accessed a global (Gonzaga’s research question is in another direction; I am always repurposing data).
Are functions that access globals, defined with fewer parameters, compared to those that do not contain any such access? The plot below shows a count of the number of functions defined to have a given number of parameters, for four systems written in C; the solid lines are functions that did not access globals, the dashed lines are functions that accessed globals (code+data).
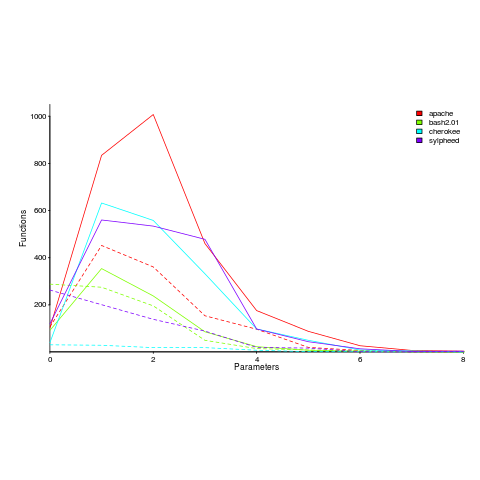
Over all 50 projects measured, functions that don’t access globals are defined, on average, to have an extra 0.7 parameters (the fitted Poisson regression models are better than a poke in the eye {i.e., the distribution is not really Poisson}, it’s more informative to look at the plotted data).
There is a lot of variation between projects (I picked these four because they were the larger projects and showed variation in behaviors). While the shape of the distributions varies a lot, there is always a noticeable difference in the mean.
Is this difference between projects a difference in developer beliefs, a difference in application requirements, a difference in developer coding habits (and parameter usage is a side effect; are there really that many getters and setters)?
I was hoping for a simple answer, and could not find one. Since I am writing a book and not researching individual issues in detail, it’s time to move on.
Ideas welcome.
Recent Comments