Positive and negative descriptions of numeric data
Effective human communication is based on the cooperative principle, i.e., listeners and speakers act cooperatively and mutually accept one another to be understood in a particular way. However, when seeking to present a particular point of view, speakers may prefer to be economical with the truth.
To attract citations and funding, researchers sell their work via the papers they publish (or blogs they write), and what they write is not subject to the Advertising Standards Authority rule that “no marketing communication should mislead, or be likely to mislead, by inaccuracy, ambiguity, exaggeration, omission or otherwise” (my default example).
When people are being economical with the truth, when reporting numeric information, are certain phrases or words more likely to be used?
The paper: Strategic use of English quantifiers in the reporting of quantitative information by Silva, Lorson, Franke, Cummins and Winter, suggests some possibilities.
In an experiment, subjects saw the exam results of five fictitious students and had to describe the results in either a positive or negative way. They were given a fixed sentence and had to fill in the gaps by selecting one of the listed words; as in the following:
             all                      all
             most                     most                  right
In this exam .... of the students got .... of the questions .....
             some                     some                  wrong
none none |
If you were shown exam results with 2 out of 5 students failing 80% of questions and the other 3 out of 5 passing 80% of questions, what positive description would you use, and what negative description would you use?
The 60 subjects each saw 20 different sets of exam results for five fictitious students. The selection of positive/negative description was random for each question/subject.
The results found that when asked to give a positive description, most responses focused on questions that were right, and when asked to give a negative description, most responses focused on questions that were wrong
How many questions need to be answered correctly before most can be said to be correct? One study found that at least 50% is needed.
“3 out of 5 passing 80%” could be described as “… most of the students got most of the questions right.”, and “2 out of 5 students failing 80%” could be described as “… some of the students got most of the questions wrong.”
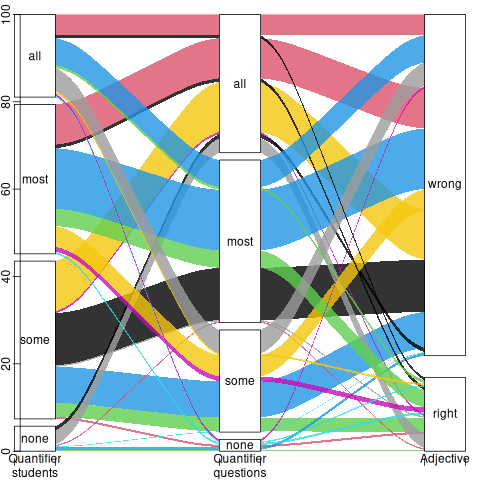
The authors fitted a Bayesian linear mixed effect models, which showed a somewhat complicated collection of connections between quantifier use and exam results. The plots below provide a visual comparison of the combination of quantifier use for positive (upper) and negative (lower) descriptions.
The alluvial plot below shows the percentage flow, for Positive descriptions, of each selected quantifier through student and question, and then adjective (code+data):

For the same distribution of exam results, the alluvial plot below shows the percentage flow, for Negative descriptions, of each selected quantifier through student and question, and then adjective (code+date):
Other adjectives could be used to describe the results (e.g., few, several, many, not many, not all), and we will have to wait for the follow-up research to this 2024 paper.
Recent Comments