Predicting reports of new faults by counting past reports
One of the many difficulties of estimating the probability of a previously unseen fault being reported is lack of information on the amount of time spent using the application; the more time spent, the more likely a previously unseen/seen fault will be experienced. Formal prerelease testing is one of the few situations where running time is likely to be recorded.
Information that is sometimes available is the date/time of fault reports. I say sometimes because a common response to an email asking researchers for their data, is that they did not record information about duplicate faults.
What information might possibly be extracted from a time ordered list of all reported faults, i.e., including reports of previously reported faults?
My starting point for answering this questions is a previous post that analysed time to next previously unreported fault.
The following analysis treats the total number of previously reported faults as a proxy for a unit of time. The LLMs used were Deepseek (which continues to give high quality responses, which are sometimes wrong), Kimi (which is working well again, after 6–9 months of poor performance and low quality chain of thought output), ChatGPT (which now produces good quality chain of thought), Grok (which has become expressive, if not necessarily more accurate), and for the first time GLM 5.1 from the company Z.ai.
After some experimentation, the easiest to interpret formula was obtained by modelling the ‘time’ between occurrences of previously unreported faults. The following is the prompt used (this models each fault as a process that can send a signal, with the Poisson and exponential distribution requirements derived from experimental evidence; here and here):
There are $N$ independent processes. Each process, $P_i$, transmits a signal, and the number of signals transmitted in a fixed time interval, $T$, has a Poisson distribution with mean $L_i$ for $1<= i <= N$. The values $L_i$ are randomly drawn from the same exponential distribution. What is the expected number of signals transmitted by all processes between the $k$ and $k+1$ first signals from the $N$ processes. |
The LLMs responses were either (based on a weekend studying the LLM chain-of-thought response): correct (GLM), very close (ChatGPT made an assumption that was different from the one made by GLM; after some back and forth prompts between the models (via me typing them), ChatGPT agreed that GLM’s assumption was the correct one), wrong but correct when given some hints (Grok without extra help goes down a Polya urn model rabbit hole), and always wrong (Deepseek, and Kimi, which normally do very well).
The expected number of previously reported faults between the  ‘th and
 ") ‘th first occurrence of an unreported fault, is:
‘th first occurrence of an unreported fault, is:
![E[F_{prev}]={k*(2N-k-1)}/{(N-k)(N-k-1)}](https://shape-of-code.com/wp-content/plugins/wpmathpub/phpmathpublisher/img/math_977_e350e5adb969b64ebc06610cb57dd38d.png "E[F_{prev}]={k*(2N-k-1)}/{(N-k)(N-k-1)}") , where
, where  is the total number of possible distinct fault reports.
The variance is: (2(N-k)^2+(k-1)(N-k)+2(k-1))}/{(N-k)^2(N-k-1)^2(N-k-2)}")
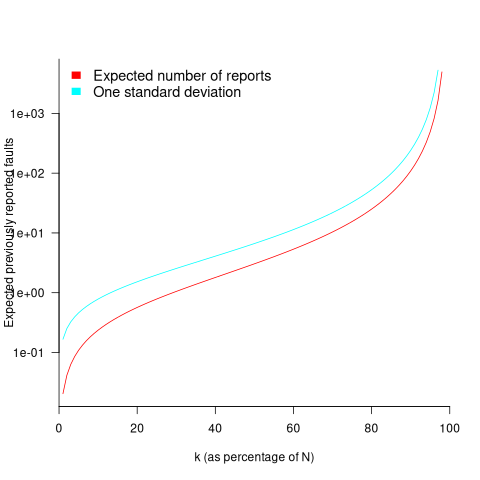
While is unknown, but there is a distinctive shape to the plot of the change in the expected number of reports against (expressed as a percentage of ), as the plot below shows (see red line; code+data):
Perhaps, for a particular program, it is possible to estimate as a percentage of by comparing the relative change in the number of previously reported faults that occur between pairs of previously unreported faults.
Unfortunately the variance in the number previously reported faults completely swamps the expected value, ![E[F_{prev}]](https://shape-of-code.com/wp-content/plugins/wpmathpub/phpmathpublisher/img/math_981.5_a5ef61e64e07d16ba49517a817b2a39a.png "E[F_{prev}]") . The blue/green line in the plot above shows the upper bound of one standard deviation, with the lower bound being zero. In other words, any value between zero and the blue/green line is within one standard deviation of the expected value. There is no possibility of reliably narrowing down the bounds for , based on an estimated position of on the red curve above 🙁
. The blue/green line in the plot above shows the upper bound of one standard deviation, with the lower bound being zero. In other words, any value between zero and the blue/green line is within one standard deviation of the expected value. There is no possibility of reliably narrowing down the bounds for , based on an estimated position of on the red curve above 🙁
To quote GLM: “The variance always exceeds the mean because of two layers of randomness: the Poisson shot noise and the uncertainty in the rates themselves.”
That is the theory. Since data is available (i.e., duplicate fault reports in Apache, Eclipse and KDE), allowing the practice to be analysed (code+data).
The above analysis assumes that the software is a closed system (i.e., no code is added/modified/deleted), and that the fault report system does not attempt to reduce duplicate reports (e.g., by showing previously reported problems that appear to be similar, so the person reporting the problem may decide not to report it).
The closed system issue can be handled by analysing individual versions, but there is no solution to duplicate report reduction systems.
Across all KDE projects around 7% of reported problems were duplicates (code+data). For specific fault classes the percentage is often lower, e.g., for the konqueror project 2% of reports deal with program crashing.
Fuzzing is another source of duplicate reports. However, fuzzers are explicitly trying to exercise all parts of the code, i.e., the input is consistently different (or is intended to be).
Summary. This analysis provides another nail in the coffin of estimating the probability of encountering a previously unseen fault and of estimating the number of fault report experiences contained in a program.
Recent Comments