Distribution of binary operator results
As numeric values percolate through a program they appear as the operands of arithmetic operators whose results are new values. What is the distribution of binary operator result values, for a given distribution of operand values?
If we start with independent random values drawn from a uniform distribution,  , then:
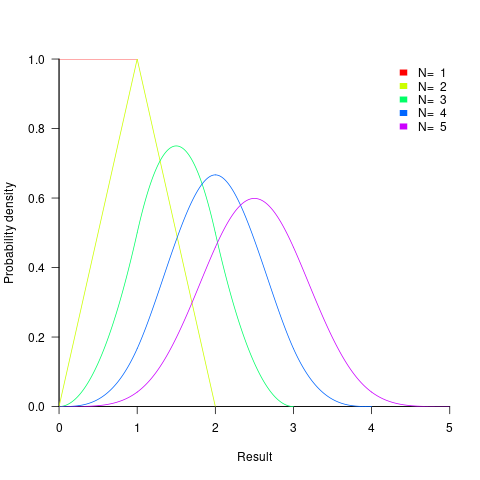
- the distribution of the result of adding two such values has a triangle distribution, and the result distribution from adding
 such values is known as the Irwin-Hall distribution (a polynomial whose highest power is
  ). The following plot shows the probability density of the result of adding 1, 2, 3, 4, and 5 such values (code+data):
- the distribution of the result of multiplying two such values has a logarithmic distribution, and when multiplying such values the probability of the result being
 is:
is: ^{N-1}/{(N-1)!}") .
.
If the operand values have a lognormal distribution, then the result also has a lognormal distribution. It is sometimes possible to find a closed form expression for operand values having other distributions.
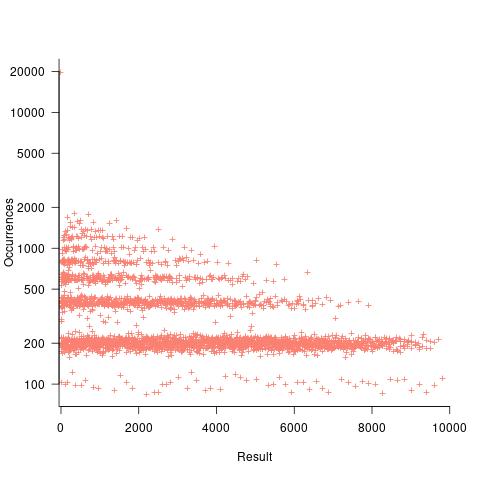
If both operands take integer values, including zero, some result values are more likely to occur than others; for instance, there are six unique factor pairs of positive integers that when multiplied return sixty, and of course prime numbers only have one factor-pair. The following plot was created by randomly generating one million pairs of values between 0 and 100 from a uniform distribution, multiplying each pair, and counting the occurrences of each result value (code+data):
- the probability of the result of dividing two such values being is: 0.5 when
 , and
, and  when
when  .
.
The ratio of two distributions is known as a ratio distribution. Given the prevalence of Normal distributions, their ratio distribution is of particular interest, it is a Cauchy distribution:
}") ,
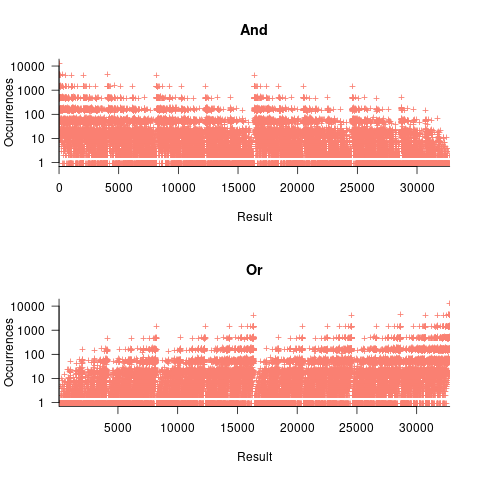
, - the result distribution of the bitwise and/or operators is not continuous. The following plots were created by randomly generating one million pairs of values between 0 and 32,767 from a uniform distribution, performing a bitwise AND or OR, and counting the occurrences of each value (code+data):
- the result distribution of the bitwise exclusive-or operator is uniform, when the distribution of its two operands is uniform.
The mean value of the Irwin-Hall distribution is  and its standard deviation is
  . As
. As  , the Irwin-Hall distribution converges to the Normal distribution; the difference between the distributions is approximately:
 ^N") .
.
The sum of two or more independent random variables is the convolution of their individual distributions,
The banding around intervals of 100 is the result of values having multiple factor pairs. The approximately 20,000 zero results are from two sets of  multiplications where one operand is zero,
The vertical comb structure is driven by power-of-two bits being set/or not. For bitwise-and the analysis is based on the probability of corresponding bits in both operands being set, e.g., there is a 50% chance of any bit being set when randomly selecting a numeric value, and for bitwise-and there is a 25% chance that both operands will have corresponding bits set; numeric values with a single-bit set are the most likely, with two bits set the next most likely, and so on. For bitwise-or the analysis is based on corresponding operand bits not being set,
The general pattern is that sequences of addition produce a centralizing value, sequences of multiplies a very skewed distribution, and bitwise operations combed patterns with power-of-two boundaries.
This analysis is of sequences of the same operator, which have known closed-form solutions. In practice, sequences will involve different operators. Simulation is probably the most effective way of finding the result distributions.
How many operations is a value likely to appear as an operand? Apart from loop counters, I suspect very few. However, I am not aware of any data that tracked this information (Daikon is one tool that might be used to obtain this information), and then there is the perennial problem of knowing the input distribution.
Recent Comments