Archive
Number of projects worked on concurrently
Developers working for companies whose business is project based are often involved with multiple projects at the same time. If one project is held up, they have other projects to work on (reducing days when there is no project for them to book their time to).
How many software projects might a developer be working on at any time, and how is their time distributed across projects?
I was hoping that the SEA Data Warehouse dataset would provide some answers. However, while it contains detailed task data on 1,211 software projects, many of the people involved on these projects also worked on projects that are not included in the dataset (or they only worked a few hours a day, or the data is not as complete as claimed).
The 2,271 distinct people in the dataset worked on a total of 210,088 person days, working an average of 190 minutes (3.2 hours) per day. The plot below shows the number of minutes worked on each of the 210,088 person days, in sorted order (code+data):

A 7.5-hour work day contains 450 minutes; what were they doing during the other 260 minutes each day? If people were not working on one of the projects in the dataset, they were presumably working on project(s) that are not in the dataset.
Within the available data, how many projects were individuals working on during various time intervals? The plot below shows the percentage of time intervals (there are more days in the year than weeks, and more weeks than months, and to make the plot easier to interpret the counts for each time interval has been normalised) where a given number of projects were worked on by an individual during a particular time interval, for day/week/month intervals, with fitted exponential models (exponents are: -2.8, -2.2, and -1.6, respectively; code+data):
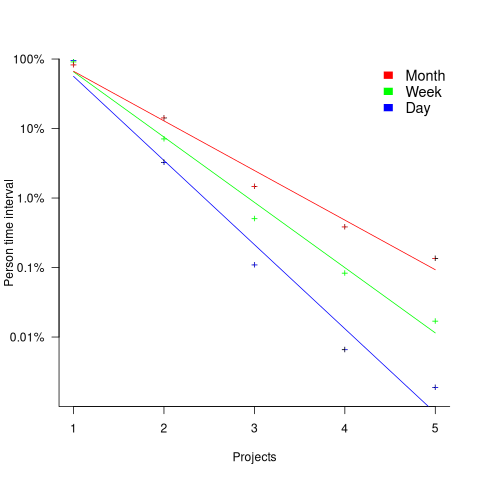
For the 1-project case, the percentage values are higher for days than weeks, and higher for weeks than months. However, the approximate nature of the fitted regression lines happens to have this the order reversed.
The plotted values are a lower bound for the number of projects an individual worked on within any of the time intervals. The average number of minutes worked per day implies that most people are working on at least two projects every day.
Pomodoros worked during a day: an analysis of Alex’s data
Regular readers know that I am always on the lookout for software engineering data. One search technique is to feed a ‘magic’ phrase into a search engine, this can locate data hiding in plain sight. This week the magic phrase: “record of pomodoros” returned pages discussing two collections of daily Pomodoros worked, each over a year, plus several possible collections, i.e., not explicitly stated. My email requests for data have so far returned one of the collections, kindly made available by Alex Altair, and this post discusses Alex’s data (I have not discussed the data with Alex, who I’m hoping won’t laugh too loud at the conclusions I have reached).
Before analyzing data I always make predictions about what I expect to see. I know from the email containing the data that it consisted of two columns: date and Pomodoro’s worked, i.e., no record of task names. The first two predictions for this data were the two most common patterns seen in estimation data, i.e., use of round numbers, and a weekend-effect (most people don’t work during the weekend and the autocorrelation of the daily counts contain peaks at lags of 6 and 7). The third prediction was that over time the daily total Pomodoro counts would refine into counts for each of the daily tasks (I had looked at the first few lines of the data and seen totals for the daily Pomodoros worked.
The Renzo Pomodoro dataset is my only previous experience analysing Pomodoro data. Renzo created a list of tasks for the day, estimated the number of Pomodoros for each task would take, and recorded how many it actually took. For comparison, the SiP effort estimation dataset estimates software engineering tasks in hours.
Alex uses Pomodoros as a means of focusing his attention on the work to be done, and the recorded data is a measure of daily Pomodoro work done.
I quickly discovered that all my predictions were wrong, i.e., no obvious peaks showing use of round numbers, no weekend effect, and always daily totals. Ho-hum.
The round number effect is very prominent in estimates, but is not always visible in actuals; unless people are aiming to meet targets or following Parkinson’s law.
How many days had one Pomodoro worked, how many two Pomodoro, etc? The plot below shows the number of days for which a given number of Pomodoros were worked (the number of days with zero Pomodoros is not shown); note the axis are log scaled. The blue points are for all days in 2020, and the green points are all days in 2020+178 days of 2021. The red lines are two sets of two fitted power laws (code+data):
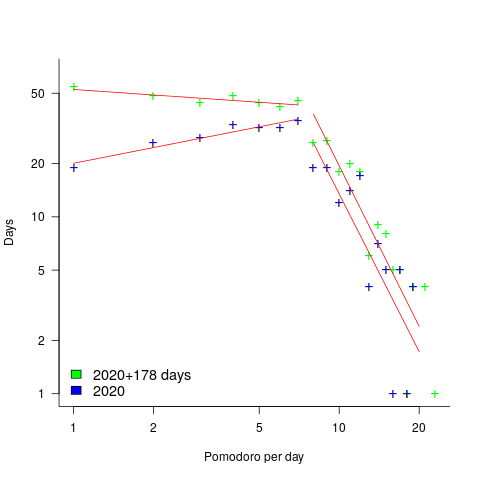
Why the sudden change of behavior after seven Pomodoro? Given a Pomodoro of 25-minutes (Alex says he often used this), seven of them is just under 3-hours, say half a day. Perhaps Alex works half a day, for every day of the week.
Why the change of behavior since the end of 2020 (i.e., exponent of left line changes from 0.3 to -0.1, exponent of right line is -3.0 in both cases)? Perhaps Alex is trying out another technique. The initial upward trend is consistent with the Renzo Pomodoro dataset.
The daily average Pomodoros worked is unchanged at around 5.6. The following plot shows daily Pomodoros worked over the 543 days, red line is a fitted loess model.
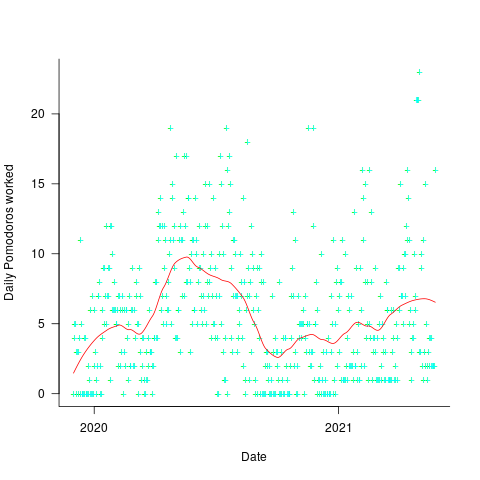
The weekend effect might not be present, but there is a strong correlation between adjacent days (code+data). The best fitting ARIMA model gives the equation:  , where:
  is the Pomodoros worked on day
  ,
,  Pomodoros worked on the previous day,
  is white noise (e.g., a Normal distribution) with a zero mean and a standard deviation of 4 (in this case) on day , and
  the previous day’s noise (see section 11.10 of my book for technical time series details).
This model is saying that the number of Pomodoros worked today is strongly influenced by yesterday’s Pomodoro worked, modulated by a large random component that could be large enough to wipe out the previous days influence. Is this likely to be news to Alex, or to anybody looking at the plot of Pomodoros over time? Probably not.
For me, the purpose of data analysis is to find patterns of behavior that are of use to those involved in the processes that generated the data (for many academics, at least in software engineering, the purpose appears to be to find patterns that can be used to publish papers, and given enough searching, it is always possible to find patterns in data). What patterns of behavior might Alex be interested in?
Does more Pomodoro work get done at the start of the week, compared to the end of the week? The following heatmap is based on the number of week days on which a given number of Pomodoros were worked. The redder the region, the more likely that value is likely to occur (code+data):

There are certainly more days near the end of the week having little or no Pomodoro work, and the high Pomodoro work days appear to be nearer the start of the week. I need to find a statistical technique that quantifies these observations.
I think that the middle plot is the most generally useful, it illustrates how variable the work done during a day can be.
Is Alex’s Pomodoro work typical or unusual? We will have to wait for a lot more data before that question can be addressed.
If you are a Pomodoro user, and have ideas for possible patterns in the data, please let me know.
As always, pointers to more data, Pomodoro or otherwise, most welcome.
Memory capacity and commercial compiler development
When I started out in the compiler business in the 80s, many commercial compilers were originally written by one person. A very good person who dedicated himself (I have never heard of a woman doing this) to the job (i.e., minimal social life) could produce a commercially viable product for a non-huge language (e.g., Fortran, Pascal, C, etc, but not C++, Ada, etc) in 12-18 months. Companies who decide to develop a compiler in-house tend to use a team of people, and take longer, because that is how they work, and they don’t want to depend on one person, and anyway such a person might not be available to them.
Commercially viable compiler development stayed within the realm of an individual effort until sometime in the early 90s. What put the single individual out of business was the growth in computer memory capacity into the hundreds of megabytes and beyond. Compilers have to be able to run within the limits of developer machines; you won’t sell many compilers that require 100M of memory if most of your customers don’t have machines with 100M+ of memory.
Code optimizers eat memory, and this prevented many optimizations that had been known about for years appearing in commercial products. Once the machines used for software development commonly contained 100M+ of memory, compiler vendors could start to incorporate these optimizations into their products.
Improvements in processor speed also helped. But developers are usually willing to let the compiler take a long time to optimize the code going into a final build, provided development compiles run at a reasonable speed.
The increase in memory capacity created the opportunity for compilers to improve, and when some did improve they made it harder for others to compete. Suddenly an individual had to spend that 12-18 months, plus many more months implementing fancy optimizations; developing a commercially viable compiler outgrew the realm of individual effort.
Some people claim that the open source model was the primary driver in killing off commercial C compiler development. I disagree. My experience of licensing compiler source was that companies preferred a commercial model they were familiar with, and reacted strongly against the idea of having to make available any changes they made to the code of an open source program. GCC (and recently llvm) succeeded because many talented people contributed fancy optimizations and these could be incorporated because developer machines contained lots of memory. If storage had not dramatically increased, gcc would probably not be the market leader it is today.
Recent Comments