Archive
Impact of input distribution on faults experienced
The impact of user input variability on number of reported faults is an important issue that is rarely researched. Appropriate user input is one of the three events that needs to occur for a software system to experience a fault. Program fault reports are caused by its users.
I am not aware of any published studies providing the evidence that a change in the distribution of program input values does indeed produce a change in the number of faults experienced. However, the supporting material of a recent paper on N-version programming contains everything needed for me to provide the evidence.
The paper N-Version Programming with Coding Agents by Ron, Baudry, and Monperrus [RBM] uses coding agents to create many implementations of the same specification.
The specification is for a missile tracking simulation program, and the input is a set of (x, y) coordinates representing two-dimensional radar tracks. The program is required to decide whether the set of points meets a combination of 15-conditions for the detection of an incoming missile, whose detection would cause the launch of an interceptor missile. Previous analysis of the RBM data.
In the RBM paper, for testing, the set of (x, y) values were randomly drawn from a uniform distribution, within bounds [-100, 100]. Drawing the (x, y) from a different distribution should cause the number of detected faults to change. I modified the test generator to use a triangular distribution. The mode (i.e., the peak) of the distribution was at: -90, 0, or 90 (the distribution is symmetric, so the results should be the same for -90 and 90; in practice they might not be {they were}).
The initialization loop at line 117 in the file generator.py was modified to call rng.triangular; for instance:
# x = [float(v) for v in rng.uniform(-100, 100, size=numpoints)] # y = [float(v) for v in rng.uniform(-100, 100, size=numpoints)] x = [float(v) for v in rng.triangular(left=-100, mode=0, right=100, size=numpoints)] y = [float(v) for v in rng.triangular(left=-100, mode=0, right=100, size=numpoints)] |
The plot below shows the three triangular distributions used, and a uniform distribution (code+data):
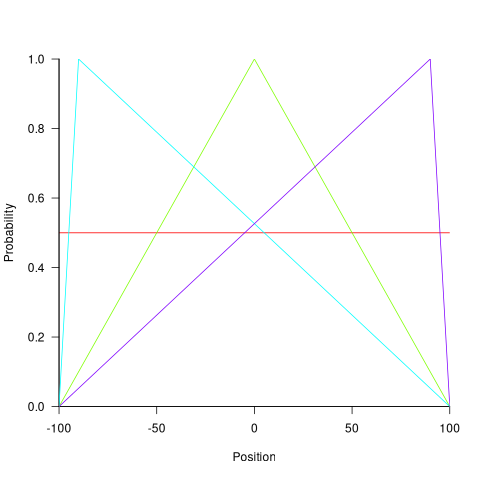
Changing the distribution of the generated points changes the average distance between two randomly chosen points. Given that the 15-conditions involve: the distance between consecutive pairs of points, and three consecutive points fitting within a circle of a given radius, a change of average distance will change the number of detected incoming missiles.
The table below shows the mean distance between two points when the (x, y) values are randomly chosen from the corresponding distribution (LLM derivation), and the corresponding normalised failure rate for three of the generated programs (replicating the original 1-million tests with four of the generated programs; code+data):
x distribution y distribution Mean distance Failure rate Uniform Uniform 104 1.0 Triangular mode 90 Uniform 93 1.9 Triangular mode 0 Uniform 89 2.0 Triangular mode 90 Triangular mode 90 82 3.6 Triangular mode 90 Triangular mode 0 76 3.7 Triangular mode 0 Triangular mode 0 73 3.9 |
The failure rate is normalised to that for the Uniform distribution. The increase in failure rate, as the mean distance between points decreases is a consequence of the particular coding mistakes in the generated programs. Different coding mistakes could produce a decreasing failure rate with distance (it decreased for the python implementation tested, but the rate did not change with distance)
The RBM study used a random number seed of 42. The maximum difference in number of detected faults, for a uniform distribution, when using seeds of 42, 202, 321, 789, 6000, and 20101 was around 10-20%. Changing the distribution had a significantly larger impact than changing the random number seed.
Recent Comments