Archive
Non-trivial data analysis using coding agents
Users cause faults in that they select the code that is executed (via the application functionality used), and provide the input that triggers the coding mistakes. Some application functionality is rarely used, while other functionality is often used. Can we go as far as to say that 20% of functionality is used 80% of the time?
The paper Are 20% of Files Responsible for 80% of Defects?, by N. Walkinshaw and L. Minku sounds like it might provide evidence to help validate the application usage assumption. The authors collected data on 100 GitHub projects, recording the files modified to fix a reported fault, plus various source code metrics. Their analysis looked for a correlation between the number of fault related fixes applied to a file and its source metrics. They did not find meaningful correlations, and that the commonly cited 80/20 split is somewhat fuzzy in practice.
I emailed the authors after the paper was published in 2018, to explain my interpretation of the 80/20 rule, i.e., driven by commonly executed code. The authors said they wanted to take the work further and were interested in exploring this alternative explanation. Researcher projects need funding, which takes time and effort to acquire, in the meantime COVID and then LLMs arrived.
Clustering a program’s source files by functionality, and then finding correlations between these clusters and fault driven fixes would once have required lots of work, and been a great PhD project. Now we have coding agents doing PhD level work in various fields. Perhaps an agent can do the heavy lifting of clustering the source files. Trusting one agent’s analysis would be naive (an analysis of one dataset by 29 independent human teams produced a surprisingly wide variety of conclusions), and the following analysis uses Claude Opus 5.5 (conversation here) and Devin (conversation here).
The paper analysed a version of each project in 2018, and the associated dataset includes the GitHub hash needed to download the corresponding snapshot of each project repo, e.g.,
https://github.com/buildbot/buildbot/archive/62ef53c36dd1d8a663f62ed4301a282a53b96d23.zip
A few Python and Java projects were downloaded as test cases. LLM performance is likely to be the strongest for these languages because of the quantity of training data available.
Not having any domain knowledge for the projects, I chose two reasonable sounding clustering factors: a description of the functionality implemented by the code contained in a file and the file’s ‘call-graph’. The first instruction give to the agent was:
The attached zip file contains a 2018 version of the buildbot Continuous Integration Framework written in python. Create a csv file containing each python file, F, one per row. Describe the application functionality implemented by the code in the file, F, and list all the other files that contain one or more functions that are called by a function in the file F. |
followed by the instruction:
Create a hierarchy of file clusters, based on the functionality they implement and use. |
The file/fault information for all the projects is contained in loc_churn_defects.csv. I’m sure the agent could have extracted the rows specific to each project, but I wanted to look at each project’s data first (old habits die hard; I also did the FpLOC calculation, got it wrong the first time, Claude pointed out my mistake and corrected it!).
The column FpLOC in the attached csv file lists the number of faults fixed per line in the python file listed in the corresponding File column. To what extent are files with high FpLOC clustered together and files with a low FpLOC clustered together. |
Both agents agreed that while there was some correlation between faults and fixes, it was at best mild. Both pointed out that file age is likely to be an important factor (i.e., more faults fixed in older files), and that adding this information could improve the correlation being sought.
The agents both took around 15 minutes elapsed time per project. The Devin chain-of-thought was interesting, while Claude was mostly uninformative while working.
Rather than spend time looking at the csv files produced (available via the conversation links above), and the summary analysis given after each question, I got the agents to write a paper:
Write a paper that describes the techniques used to describe each file, the hierarchical clustering algorithm, followed by the results of the investigating to find a connection between fault fixed and clustering. Suggest factors that limit the accuracy of the analysis and what could be done to gain a greater understanding of the connection between files and fixed faults |
The Claude Opus report was rather poor (just one graph; perhaps there is a data analysis toggle that needs to be set), while the Devin report was rather good (interesting graphs and analysis).
Without information on the age of the files, a very important factor, this dataset is not sufficient to say anything reliable about a possible 20/80 split.
Both Clause Opus 5.5 and Devlin performed very well. When doing research for real I would want more chain-of-thought, both to gain confidence about the final answer and to read about possible new ideas. The chain-of-thought provided by Chinese models makes them my first choice for building mathematical models. I need to experiment with the Chinese coding agents.
Impact of input distribution on faults experienced
The impact of user input variability on number of reported faults is an important issue that is rarely researched. Appropriate user input is one of the three events that needs to occur for a software system to experience a fault. Program fault reports are caused by its users.
I am not aware of any published studies providing the evidence that a change in the distribution of program input values does indeed produce a change in the number of faults experienced. However, the supporting material of a recent paper on N-version programming contains everything needed for me to provide the evidence.
The paper N-Version Programming with Coding Agents by Ron, Baudry, and Monperrus [RBM] uses coding agents to create many implementations of the same specification.
The specification is for a missile tracking simulation program, and the input is a set of (x, y) coordinates representing two-dimensional radar tracks. The program is required to decide whether the set of points meets a combination of 15-conditions for the detection of an incoming missile, whose detection would cause the launch of an interceptor missile. Previous analysis of the RBM data.
In the RBM paper, for testing, the set of (x, y) values were randomly drawn from a uniform distribution, within bounds [-100, 100]. Drawing the (x, y) from a different distribution should cause the number of detected faults to change. I modified the test generator to use a triangular distribution. The mode (i.e., the peak) of the distribution was at: -90, 0, or 90 (the distribution is symmetric, so the results should be the same for -90 and 90; in practice they might not be {they were}).
The initialization loop at line 117 in the file generator.py was modified to call rng.triangular; for instance:
# x = [float(v) for v in rng.uniform(-100, 100, size=numpoints)] # y = [float(v) for v in rng.uniform(-100, 100, size=numpoints)] x = [float(v) for v in rng.triangular(left=-100, mode=0, right=100, size=numpoints)] y = [float(v) for v in rng.triangular(left=-100, mode=0, right=100, size=numpoints)] |
The plot below shows the three triangular distributions used, and a uniform distribution (code+data):
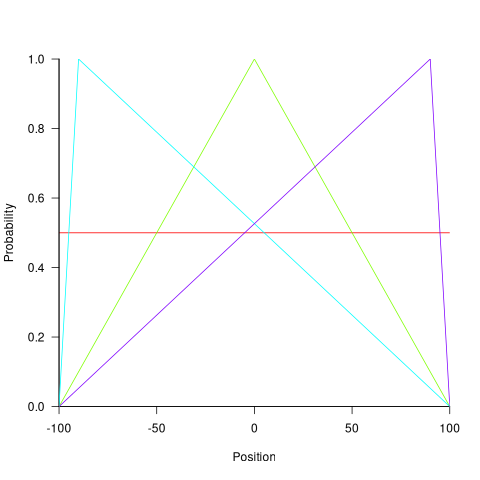
Changing the distribution of the generated points changes the average distance between two randomly chosen points. Given that the 15-conditions involve: the distance between consecutive pairs of points, and three consecutive points fitting within a circle of a given radius, a change of average distance will change the number of detected incoming missiles.
The table below shows the mean distance between two points when the (x, y) values are randomly chosen from the corresponding distribution (LLM derivation), and the corresponding normalised failure rate for three of the generated programs (replicating the original 1-million tests with four of the generated programs; code+data):
x distribution y distribution Mean distance Failure rate Uniform Uniform 104 1.0 Triangular mode 90 Uniform 93 1.9 Triangular mode 0 Uniform 89 2.0 Triangular mode 90 Triangular mode 90 82 3.6 Triangular mode 90 Triangular mode 0 76 3.7 Triangular mode 0 Triangular mode 0 73 3.9 |
The failure rate is normalised to that for the Uniform distribution. The increase in failure rate, as the mean distance between points decreases is a consequence of the particular coding mistakes in the generated programs. Different coding mistakes could produce a decreasing failure rate with distance (it decreased for the python implementation tested, but the rate did not change with distance)
The RBM study used a random number seed of 42. The maximum difference in number of detected faults, for a uniform distribution, when using seeds of 42, 202, 321, 789, 6000, and 20101 was around 10-20%. Changing the distribution had a significantly larger impact than changing the random number seed.
One code path dominates method execution
A recurring claim is that most reported faults are the result of coding mistakes in a small percentage of a program’s source code, with the 80/20 ‘rule’ being cited for social confirmation. I think there is something to this claim, but that the percentages are not so extreme.
A previous post pointed out that reported faults are caused by users. The 80/20 observation can be explained by users only exercising a small percentage of a program’s functionality (a tiny amount of data supports this observation). Surprisingly, there are researchers who believe that a small percentage of the code has some set of characteristics which causes it to contain most of a program’s coding mistakes (this belief has the advantage that a lot of source code is easily accessible and can be analysed to produce papers).
To what extent does user input direct program execution towards a small’ish subset of the code available to be executed?
The recent paper: Monitoring the Execution of 14K Tests: Methods Tend to Have One Path That Is Significantly More Executed by Andre Hora counted the number of times each path through a method’s source code was executed, when the method was called, for the 5,405 methods in 25 Python programs. These programs were driven by their 14,177 tests, rather than user input. The paper is focused on testing, in particular developer that developers tend to focus on positive tests.
Test suites are supposed to exercise all of a program’s source, so it is to be expected that these measurements will show a wider dispersion of code coverage than might be expected of typical user input.
The measurements also include a count of the lines executed/not executed along each executed method path. No information is provided on the number of unexecuted paths.
Within a method, there is always going to one path through the code that is executed more often than any other path. What this study found is that the most common path is often executed many more times than the other paths. The plot below shows, for each method (each +), the percentage of all calls to a method where the most common path was executed, against the total number of executed paths for that method; red/blue lines are fitted power law/exponential regression models, and the grey line shows the case where percentage executed is the fraction for a given number of paths (code+data):
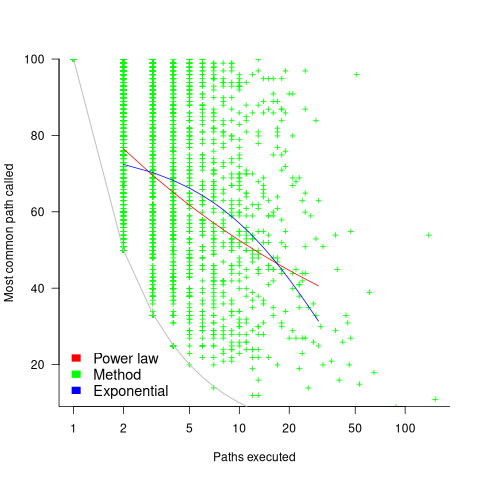
On average, the most common path is executed around four times more often than the second most commonly executed path.
While statistically significant, the fitted models do not explain much of the variance in the data. An argument can be made for either a power law and exponential distribution, and not having a feel for what to expect, I fitted both.
Non-error paths through a method have been found to be longer than the error paths. These measurements do not contain the information needed to attempt to replicate this finding.
New paths through a method are created by conditional statements, and the percentage of such statements in a method tends to be relatively constant across methods. The plot below shows the percentage of all calls to a method where the most common path was executed, where the method (each +) contains a given LOC; red/blue lines are fitted power law/exponential regression models (code+data):
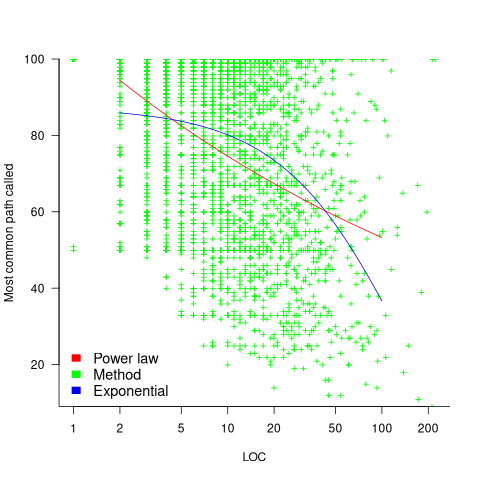
The models fitted to against LOC are better than those fitted against paths executed, but still not very good. A possible reason is that some methods will have unexecuted paths, LOC is a good proxy for total paths, and most common path percentage depends on total paths.
On average, 56% of a method’s LOC are executed along the most frequently executed path. When weighted by the number of method calls, the percentage is 48%.
The results of this study show that a call to most methods is likely to be dominated by the execution of one sequence of code. Another way that in which a small amount of code can dominate program execution is when most calls are to a small subset of the available methods. The plot below shows a density plot for the total number of calls to each method (code+data):
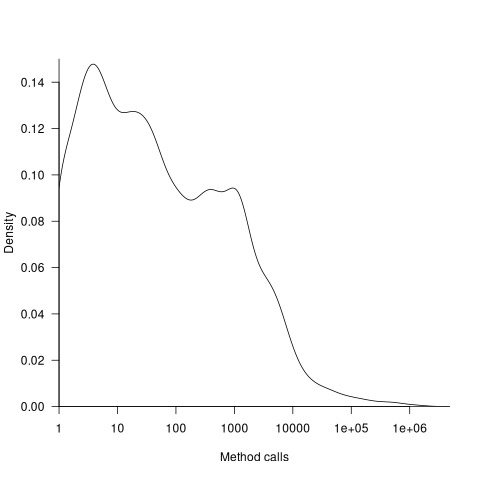
Around 62% of methods are called less than 100 times, while 2.6% are called over 10,000 times.
Recent Comments