Archive
Working with an LLM maths assistant to model software processes
This post is a overview of the techniques I use when working with LLMs as a mathematics assistant to derive equations for the aggregate behavior of a collection of software processes. Much of the following could well apply to non-software processes, but my experience is software based.
Any analysis starts with one or more questions/problems and the environment within which any answer is likely to be applicable. Possible questions include:
- Expected number of lines of code, LOC, in the next release of a program,
- number of distinct statement sequences that can be written using

if-statements and
assignmentstatements, - fraction of a program’s functions/methods that have not been modified after fixing all reported faults.
Prompting an LLM with a software related question is likely to result in it giving a software related answer summarising statements made on blogs and perhaps findings from various research papers. These summaries may, or may not, contain the desired answer.
Obtaining a mathematical answer requires that a mathematical question be asked. The software question has to be reframed in mathematical terms. This requires some creativity, lateral thinking, and prior experience is very helpful.
For instance, for question 1, expected lines of code could be reframed as a recurrence relation, such as  , where:
  is the LOC in the
  ‘th release, and
  ,
,  are constants. An LLM can solve this to relation to give an equation for based on , , and
  (the size of the first release).
A more sophisticated set of recurrence relations could include the number of developers working on the project, along the probability distribution of the number of LOC they produce per day/week/month/release, and an equation for the expected time between releases.
Expressing question 2 in mathematical terms requires some lateral thinking. One possibility is to treat each line of code as a step on a 2-D lattice. An assignment statement occupying a line is one step down the page, while an if-statement occupies both a line and is (usually) indented to the right of the previous statement at the start, and indented to the left when it ends. Paths through a lattice are a well studied problem, with lots of existing mathematics for LLMs to have been trained on. This reframing of the question was good enough for me to be able to shepherd ChatGPT towards deriving an answer to the question. My pre-LLM research for answering a related question helped.
Creating a mathematical description of a question requires a lot of hard thinking (at least it does for me), and is an iterative process. If you are lucky, a good enough mapping to a starting formula is found, and the mathematics appears in textbooks, e.g., question 1. For other questions, lateral thinking may produce a mapping to a well researched area within some mathematical niche, e.g., question 2.
Creating a correct mathematical specification of the question is essential. Get this specification wrong, and any final equation will be the answer to a different question than the one intended. Mathematicians are used to describing problems in mathematical terms, while non-mathematicians (like me, and I suspect many readers) are likely to make mistakes and under/over specify the problem.
What can be done to check whether an LLM has interpreted the question in the way intended?
LLM chain-of-thought output provides the required feedback about how it interprets the question given. Some LLMs provide chain-of-thought output of their interpretation of the information contained in the prompt (e.g., Deepseek and Kimi), while others (e.g., until recently both ChatGPT and Grok; both have improved in the last few months) provide none, i.e., they are silent for a long time before giving an answer (which is can be useful for double-checking the output from other LLMs, but is otherwise of little use).
The following discussion is based on the process I used to obtain an answer to question 3.
The number of ways of placing some number of balls in some number of boxes is an established mathematical area of study that can be mapped to question 3. Functions are treated as empty boxes and fault reports as balls that are randomly placed in these boxes.
The initial mathematical question contains the minimum of constraints, and successive questions added constraints to better mimic the characteristics of source code and fault reports.
The following was my starting question:
$m$ identical boxes can each hold a maximum of $L$ balls, and there are $b$ identical balls, balls are uniformly at randomly placed in non-full boxes, where $L < m$ and $m*L > b$ and $b$ can have a similar size as $m$ What is the expected number of boxes that do not contain a ball |
The mathematics is enclosed in $ characters. LLMs support LaTeX input and output mathematics using LaTeX.
The first two lines specify the structure of the system. It’s important to specify that the balls are identical, otherwise the LLM has to decide whether they are, or are not, identical (non-identical has a very different solution).
The third line specifies the process behavior. The phrase “uniformly at randomly” is the mathematical way of saying “the behavior is random with all possibilities being equally likely”. When I first started using LLMs, this phrase is not something I used. However, “uniformly at randomly” often appeared in LLM output, so I switched to using it (LLMs having been trained on a lot more maths than me).
Lines four and five specify relationships between variables. Sometimes constraints such as these reduce the space of possibilities, and lead to a more concise answer. These constraints specify that a function will not contain more reported faults than it has lines of code (which is not always true), and that a program will not have more reported faults than lines of code.
The last line is the question I want answered (Kimi response).
In practice functions don’t all have the same size. Most functions are short, with fewer longer ones. The number of functions containing a given number of lines has (roughly) a power law distribution. Adding this information to the problem gives:
There are $m$ boxes, $B_n$, $1 <= n <= m$ where the
number of boxes that can hold $L$ balls, $1 <= L <= T$,
is proportional to $L^{-b}$,
and there are $F$ identical balls,
balls are uniformly at randomly placed in non-full boxes,
where the number of balls $F$ is much less than
the available places to hold them.
What is the expected number of boxes that do not contain a ball |
Boxes can now have different sizes, so they need to be labelled (i.e., $B_n$), with ball carrying capacity specified as a power law, i.e., $L^{-b}$.
The explicit constraints previously given are replaced by the general statement: “… the number of balls $F$ is much less than the available places to hold them.” This gives the LLM some flexibility about how to interpret the constraint.
LLMs make mistakes. I have seen them make a basic algebra mistake on one output line, followed by output that looks like penetrating insight (if a human had made it).
The chain-of-thought output reads like a derivation that a human would write (at least it does for Kimi, Deepseek, and recently GLM 5.1 from Z.ai). Checking the correctness of this derivation is necessary to gain confidence that the final answer is correct, or not.
This chain-of-thought often makes use a theorem or identity that is new to me. Kimi’s response to the updated prompt above made use of the polylogarithm function, which I had heard of, but knew nothing about.
When new to me maths is generated, Wikipedia is the first place I look. However, some Wikipedia maths articles appear to be written by mathematicians, who assume the reader already understands the topic, and simply summarise the relevant details; which is useless. Of course, one can always ask an LLM (a different one, so there is some cross-checking).
If the chain-of-thought looks correct, is the answer correct?
An LLM once give me an answer that was obviously wrong. It was an equation that could produce negative values, and in practice only positive values were possible. Each step of the chain-of-thought looked correct. It took me a while to spot that two disjoint assumptions in the LLM analysis combined to produce the incorrect answer.
I usually have an expectation of the behavior of any answer. Plotting the value of the equation given in an answer can show whether it follows the pattern of expected behavior.
Another way of gaining confidence in the answer is to give the prompt to multiple LLMs. Sometimes they all agree, and sometimes they disagree. The disagreement may be because the answer has been written in a slightly different form (e.g., summing a series from zero rather than one), or because the LLMs made slightly different assumptions. Comparing chain-of-thought will locate the points where assumptions diverge.
The third major iteration tried to address the observation that some functions are executed more often than others, and so are more likely to be involved in a fault report.
The specification was updated to include a preferential attachment component, with a box containing a ball having a higher probability of receiving a ball than one that did not contain a ball. The added text:
balls are randomly placed in non-full boxes with probability proportional to $L*(1+O)$ where $O$ is the number of ballscurrently in the box,
The equation in the answer was rather complicated (ChatGPT response). I have not checked this equation.
Most of the mathematically oriented questions/problems I have worked on have turned out to have uninteresting answers. Knowing this I can cross them off my list of things to think about. A few might lead to something interesting (e.g., fault prediction is starting to look like a waste of time), but need more work.
The answer checking process increases confidence that a particular answer is a solution to the question asked. It is possible that the specification of the question asked does not have a strong connection to reality.
My current first choice of LLMs for mathematical problems are Deepseek, Kimi, and recently GLM 5.1 (which has compute availability issues). This is primarily because they provide chain-of-thought output. In the last few months both ChatGPT and Grok have started providing more chain-of-thought output.
I usually start with one LLM to refine the question, and depending on progress later involve other LLMs to check and verify output.
Algorithm complexity and implementation LOC
As computer functionality increases, it becomes easier to write programs to handle more complicated problems which require more computing resources; also, the low-hanging fruit has been picked and researchers need to move on. In some cases, the complexity of existing problems continues to increase.
The Linux kernel is an example of a solution to a problem that continues to increase in complexity, as measured by the number of lines of code.
The distribution of problem complexities will vary across application domains. Treating program size as a proxy for problem complexity is more believable when applied to one narrow application domain.
Since 1960, the journal Transactions on Mathematical Software has been making available the source code of implementations of the algorithms provided with the papers it publishes (before the early 1970s they were known as the Collected Algorithms of the ACM, and included more general algorithms). The plot below shows the number of lines of code in the source of the 893 published implementations over time, with fitted regression lines, in black, of the form  before 1994-1-1, and
  after that date (black dashed line is a LOESS regression model; code+data).
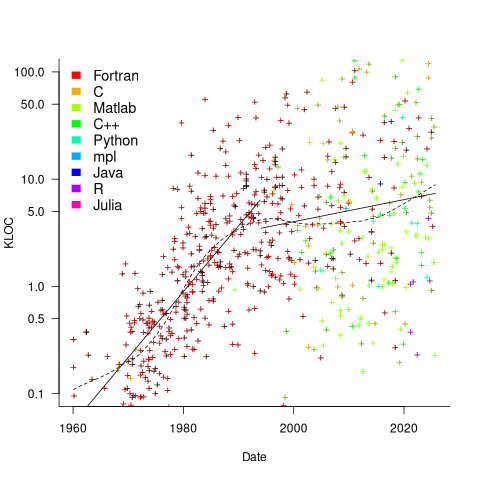
The two immediately obvious patterns are the sharp drop in the average rate of growth since the early 1990s (from 15% per year to 2% per year), and the dominance of Fortran until the early 2000s.
The growth in average implementation LOC might be caused by algorithms becoming more complicated, or because increasing computing resources meant that more code could be produced with the same amount of researcher effort, or another reason, or some combination. After around 2000, there is a significant increase in the variance in the size of implementations. I’m assuming that this is because some researchers focus on niche algorithms, while others continue to work on complicated algorithms.
An aim of Halstead’s early metric work was to create a measure of algorithm complexity.
If LLMs really do make researchers more productive, then in future years LOC growth rate should increase as more complicated problems are studied, or perhaps because LLMs generate more verbose code.
The table below shows the primary implementation language of the algorithm implementations:
  Language   Implementations
   Fortran        465
         C         79
    Matlab         72
       C++         24
    Python          7
         R          4
      Java          3
     Julia          2
MPL 1 |
If algorithms are becoming more complicated, then the papers describing/analysing them are likely to contain more pages. The plot below shows the number of pages in the published papers over time, with fitted regression line of the form  (0.38 pages per year; red dashed line is a LOESS regression model; code+data).
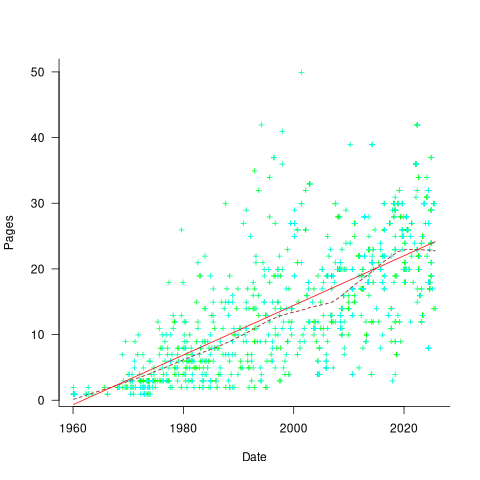
Unlike the growth of implementation LOC, there is no break-point in the linear growth of page count. Yes, page count is influence by factors such as long papers being less likely to be accepted, and being able to omit details by citing prior research.
It would be a waste of time to suggest more patterns of behavior without looking at a larger sample papers and their implementations (I have only looked at a handful).
When the source was distributed in several formats, the original one was used. Some algorithms came with build systems that included tests, examples and tutorials. The contents of the directories: CALGO_CD, drivers, demo, tutorial, bench, test, examples, doc were not counted.
Formal methods and LLM generated mathematical proofs
Formal methods have been popping up in the news again, or at least on the technical news sites I follow.
Both mathematics and software share the same pattern of usage of formal methods. The input text is mapped to some output text. Various characteristics of the output text are checked using proof assistant(s). Assuming the mapping from input to output is complete and accurate, and the output has the desired characteristics, various claims can then be made about the input text, e.g., internally consistent. For software systems, some of the claims of correctness made about so-called formally verified systems would make soap powder manufacturers blush.
Mathematicians have been using LLMs to help find proofs of unsolved maths problems. Human written proofs are traditionally checked by other humans reading them to verify that the claimed proof is correct. LLMs generated proofs are sometimes written in what is called a formal language, this proof-as-program can then be independently checked by a proof assistant (the Lean proof assistant is a popular choice; Rocq is popular for proofs about software).
Software developers are well aware that LLM generated code contains bugs, and mathematicians have discovered that LLM generated proof-programs contain bugs. A mathematical proof bug involves Lean reporting that the LLM generated proof is true, when the proof applies to a question that is different from the actual question asked. Developers have probably experienced the case where an LLM generates a working program that does not do what was requested.
An iterative verification-and-refinement pipeline was used for LLMs well publicised solving of International Mathematical Olympiad problems.
A cherished belief of fans of formal methods is that mathematical proofs are correct. Experience with LLMs shows that a sequence of steps in a generated proof may be correct, but the steps may go down a path unrelated to the question posed in the input text. Also, proof assistants are programs, and programs invariably contain coding mistakes, which sometimes makes it possible to prove that false is true (one proof assistant currently has 83 bug reports of false being proved true).
It is well known, at least to mathematicians, that many published proofs contain mistakes, but that these can be fixed (not always easily), and the theorem is true. Unfortunately, journals are not always interested in publishing corrections. A sample of 51 reviews of published proofs finds that around a third contain serious errors, not easily corrected.
Human written proofs contain intentional gaps. For instance, it is assumed that readers can connect two steps without more details being given, or the author does not want to deter reviewers with an overly long proof. If LLM generated proofs are checked by proof assistants, then the gap between steps needs to be of a size supported by the assistant, and deterring reviewers is not an issue. Does this mean that LLM generated proof is likely to be human unfriendly?
Software is often expressed in an imperative language, which means it can be executed and the output checked. Theorems in mathematics are often expressed in a declarative form, which makes it difficult to execute a theorem to check its output.
For software systems, my view is that formal methods are essentially a form of -version programming, with  . Two programs are written, with one nominated to be called the specification; one or more tools are used to analyse both programs, checking that their behavior is consistent, and sometimes other properties. Mistakes may exist in the specification program or the non-specification program.
Using LLMs to help solve mathematical problems is a rapidly evolving field. We will have to wait and see whether end-to-end LLM generated proofs turn out to be trustworthy, or remain as a very useful aid.
Fifth anniversary of Evidence-based Software Engineering book
Yesterday was the 5th anniversary of the publication of my book Evidence-based Software Engineering.
The general research trajectory I was expecting in the 2020s (e.g., more sophisticated statistical analysis and more evidence based studies) has been derailed by the arrival of LLMs three years ago. Almost all software engineering researchers have jumped on the LLM bandwagon, studying whatever LLM use case is likely to result in a published paper. While I have noticed more papers using statistical techniques discovered after the digital computer was invented (perhaps influenced by the second half of the book), there seems to be a lot fewer evidence based papers being published. I don’t expect researches studying software engineering to jump off the LLM bandwagon in the next few years.
The net result of this lack of new research findings is that the book contents are not yet in need of an update.
On a positive note, LLMs’ mathematical problem-solving capabilities have significantly reduced the time needed to analyse models of software engineering processes.
Had today’s LLMs been available while I was writing the book, the text would probably have included many more theoretical models and their analysis. ‘Probably’, because sometimes the analysis finds that a model does not provide meaningfully mimic reality, so it’s possible that only a few more models would have been included.
My plan for the next year is to use LLM’s mathematical problem-solving capabilities to help me analyse models of software engineering processes. A discussion of any interested results found will appear on this blog. I’m hoping that there will be active conversations on the evidence based software engineering Discord channel.
It makes sense to hone my model analysis skills by starting with the subject I am most familiar with, i.e., source code. It also helps that tools are available for obtaining more source measurement data.
I will continue to write about any interesting papers that appear on the arXiv lists cs.se and cs.PL, as well as the major conferences. There won’t be time to track the minor conferences.
Questions raised during model analysis sometimes suggest ideas that, when searched for, lead to new data being discovered. Discovering new data using a previously untried search phrase is always surprising.
Percentage of methods containing no reported faults
It is often said, with some evidence, that 80% of reported faults, for a program, occur in 20% of its code. I think this pattern is a consequence of 20% of the code being executed 80% of the time, while many researchers believe that 20% of the source code has characteristics that result in it containing 80% of the coding mistakes.
The 20% figure is commonly measured as a percentage of methods/functions, rather than a percentage of lines of code.
This post investigates the expected fraction of a program’s methods that remain fault report free, based on two probability models.
Both models assume that coding mistakes are uniformly scattered throughout the code (i.e., every statement has the same probability of containing a mistake) and that the corresponding coding mistake is contained within a single method (the evidence suggests that this is true for 50% of faults).
A simple model is to assume that when a new fault is reported, the probability that the corresponding coding mistake appears in a particular method is proportional to the method’s length,  in lines of code, of the method. The evidence shows that the distribution of methods containing a given number of lines, , is well-fitted by a power law (for Java:
  ).
).
If  reported faults have been fixed in a program containing
  methods/functions, what is the expected number of methods that have not been modified by the fixing process?
The answer (with help from: mostly Kimi, with occasional help from Deepseek (who don’t have a share chat options), ChatGPT 5, Grok, and some approximations; chat logs) is:
}Li_b(e^{-{F/M}{{zeta(b)}/{zeta(b-1)}}})")
where:  is the Riemann zeta function,
  is the polylogarithm function and
  for Java.
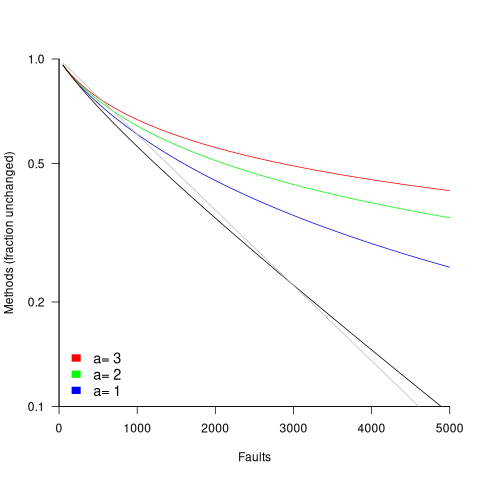
The plot below shows the predicted fraction of unmodified methods against number of faults, for programs of various sizes; the grey lines show the rough approximation:  (code+data):
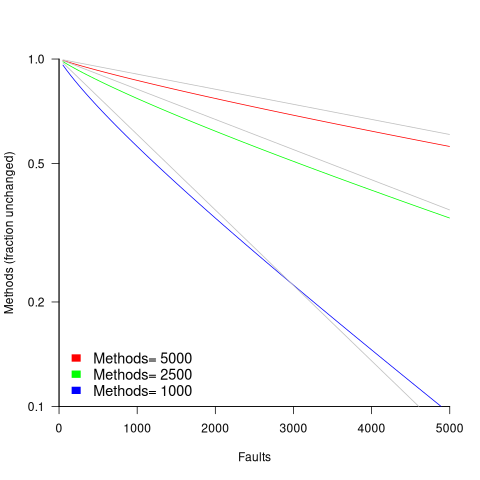
The observed behavior of most reported faults involving a subset of a program’s methods can be modelled using some form of preferential attachment.
One preferential attachment model specifies that the likelihood of a coding mistake appearing in a method is proportional to ") , where
, where  is the number of previously detected coding mistakes in the method.
The estimated number of unmodified methods is now:
}Li_b(({M zeta(b-1)}/{M zeta(b-1)+a*(F+1) zeta(b)})^{1/a})")
where: is the average value of  over all faults (if
  , then
  for a power law with exponent 2.35).
The plot below shows the predicted fraction of unmodified methods against number of faults for a program containing 1,000 methods, for various values of , with the black line showing the fraction of unmodified methods predicted by the simple model above (code+data):
In practice, random selection of the method containing a coding mistake will introduce some fuzziness in the predicted fraction of unmodified methods.
As the number of reported faults grows, the attraction of methods involved in previous reported faults slows the rate at which methods experience their first detected coding mistake.
How realistic are these models?
By focusing on the number of unmodified methods, many complications are avoided.
Both models assume that an unchanging number of methods in a program and that the length of each method is fixed. This assumption holds between each release of a program.
For actively maintained programs, the number of methods in a program changes over time, and the length of some existing methods also changes (if a program were not actively maintained, reported faults would not get fixed).
These models are unlikely to be applicable to programs with short release cycles, where there are few reported faults between releases.
How well do the models’ predictions agree with the data?
At the moment, I am not aware of a dataset containing the appropriate data. Number of faults vs unmodified methods has been added to my list of interesting patterns to notice.
Summary of the derivation of the solutions for the two models.
Simple model
The expected number of unmodified methods, ") , is:
, is:
=sum{L=1}{T}{m_L{P(U_LF)}}") , where
, where  is the length of the longest method,
  is the number of methods of length , and
 ") is the probability that a method of length will be unmodified after fault reports.
is the probability that a method of length will be unmodified after fault reports.
The evidence shows that the distribution of methods containing a given number of lines, , is well-fitted by a power law (for Java: ).
Given a program containing methods, the number of methods of length is:
 , where for Java.
If is large and  , then the sum can be approximated by the Riemann zeta function, , giving:
}}")
The probability that a method containing lines will not be modified by a fault report (assuming that fixing the mistake only involves one method) is:  , where
  is the total lines of code in the program, and the probability of this method not being modified after fault reports is approximately:
^F approx e^{{-F*L}/{P_t}}")
The expected number of empty boxes is:
}}*e^{{-F*L}/{P_t}}}=M/{zeta(b)}Li_b(e^{-F/{P_t}})")
The number of lines of code in a program containing methods is:
}}}=M/{zeta(b)}sum{L=1}{T}{L^{1-b}}=M{{zeta(b-1)}/{zeta(b)}}")
Finally giving:
}Li_b(e^{-{F/M}{{zeta(b)}/{zeta(b-1)}}})")
where is the polylogarithm function.
This equation is roughly, for the purposes of understanding the effect of each variable:

Preferential attachment model
When a mistake is corrected in a method, the attraction weight of that method increases (alternatively, the attraction weight of the other methods decreases). The probability that a method is not modified after fault reports is now:
}=prod{k=0}{F}{{P_t+a*k-L}/{P_t+a*k}}={Gamma({P_t}/a)Gamma({P_t-L}/a+F+1)}/{Gamma({P_t-L}/a)Gamma(P_t/a+F+1)}")
where:  the average value of over all faults, and
  is the gamma function.
applying the Stirling/Gamma–ratio rule, i.e., }/{Gamma(z+b)} approx z^{a-b}") we get:
we get:
})^{F/a} = ((P_t/{P_t+a*(F+1)})^{1/a})^F")
where the expression ^{1/a})^F") is the preferential attachment version of the expression
is the preferential attachment version of the expression ^F") appearing in the simple model derivation. Using this preferential attachment expression in the analysis of the simple model, we get:
appearing in the simple model derivation. Using this preferential attachment expression in the analysis of the simple model, we get:
I don’t have a rough approximation for this expression.
Number of statement sequences possible using N if-statements
I recently read a post by Terence Tao describing how he experimented with using ChatGPT to solve a challenging mathematical problem. A few of my posts contain mathematical problems I could not solve; I assumed that solving them was beyond my maths pay grade. Perhaps ChatGPT could help me solve some of them.
To my surprise, a solution was found to the first problem I tried.
I simplified the original problem (involving Motzkin numbers, details below) down to something that was easier for me to explain to ChatGPT. Based on ChatGPT’s response, it appeared lost, so I asked what it knew about Motzkin numbers. I then reframed the question around the concepts in its response, and got a response that, while reasonable, was not a solution. My question was not precise enough, and a couple of question/answer iterations later, ChatGPT broke the problem down into a series of steps that I saw could solve the problem. While the equation it used in its answer was just wrong, I knew what the correct equation was. So while ChatGPT frequently went off in the wrong direction and got its maths wrong, it helped me refine my statement of the problem and ChatGPT eventually gave steps to a solution which were blindingly obvious to me when I read them.
The question I wanted to answer was: How many distinct statement sequences can be created using if-statements and  simple-statements (for a total of
  statements)?
A simple-statement might be an assignment or function call, but not any kind of compound statement, such as a loop. Three sequences are possible using one if-statement and two simple-statements. The if-statement occupies two lines, i.e., the condition and termination curly-bracket, }, as follows:
s1; if (c1) { if (c1) { if (c1) { s1; s1; s2; s2; } } } s2; |
In a previous post I showed how a variant of this question, involving any number of if-statements, can be mapped to a combinatorial interpretation of Motzkin numbers and treating matching up/down diagonals along a path as an if-statement.

ChatGPT performed poorly when I phrased the problem in combinatorial terms (or perhaps my phrasing was poor), so I switched to using a lattice path approach. I asked: “How many lattice paths of length S containing exactly N occurrences of the step (1, 1) and N occurrences of the step (1, -1) are possible?”, and after reading the response I replied “Your analysis does not take into account the fact that the path cannot go below the x-axis. Rework your analysis to take this restriction into account.”
The following is my edited version of ChatGPT’s ‘solution’ response (sorry, no link to chat):
“Problem Restated:
We need to count the number of valid Dyck paths of length , where the path consists of:
Exactly upward steps (1,1).
Exactly downward steps (1,−1).
The remaining steps (which must be horizontal steps (1,0)).
These paths must never dip below the x-axis, and they must return to the x-axis at the end.
…
Step 2: Catalan Numbers for Balanced Paths
If we ignore the horizontal steps for the moment, the number of ways to place upward steps and downward steps such that the path does not go below the x-axis is given by the Catalan number  :
:
={(2*N)!}/{(N+1)!N!}")
This Catalan number counts the number of valid ways to arrange the upward steps and downward steps such that the path remains above or on the x-axis.
Step 3: Placing Horizontal Steps
Once the valid upward and downward steps have been arranged in a Catalan structure, we can freely place the horizontal steps (1,0) in the remaining positions of the path. Since there are  steps (upward and downward) and horizontal steps, there are
  gaps (before, after, or between the upward/downward steps) where the horizontal steps can be placed.
The number of ways to place horizontal steps in these positions is given by a binomial coefficient:”
For some reason, ChatGPT gives the wrong binomial coefficient. Calculating the number of ways of distributing  items into
  bins is a well known problem; when a bin can contain zero items, the solution is:
 ={(x+y-1)!}/{(y-1)!x!}") .
.
Combining the equations from the two steps gives the number of distinct statement sequences that can be created using if-statements and simple-statements as:
={(2*N)!}/{(N+1)!N!}{S!}/{(2*N)!(S-2*N)!}={S!}/{{(N+1)!N!}(S-2*N)!}")
The above answer is technically correct, however, it fails to take into account that in practice an if-statement body will always contain either another if-statement or a simple statement, i.e., the innermost if-statement of any nested sequence cannot be empty (the equation used for distributing items into bins assumes a bin can be empty).
Rather than distributing statements into gaps, we first need to insert one simple statement into each of the innermost if-statements. The number of ways of distributing the remaining statements are then counted as previously. How many innermost if-statements can be created using if-statements? I found the answer to this question in a StackExchange question, using traditional search.
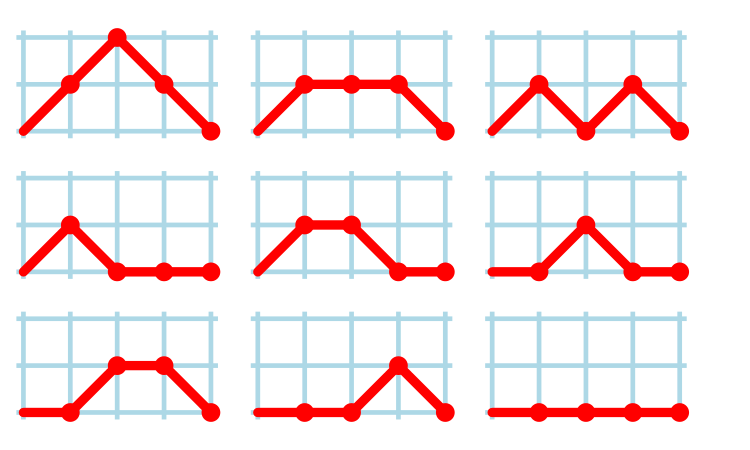
The question can be phrased in terms of peaks in Dyck paths, and the answer is contained in the Narayana numbers (which I had never heard of before). The following example, from Wikipedia, shows the number of paths containing a given number of peaks, that can be produced by four if-statements:
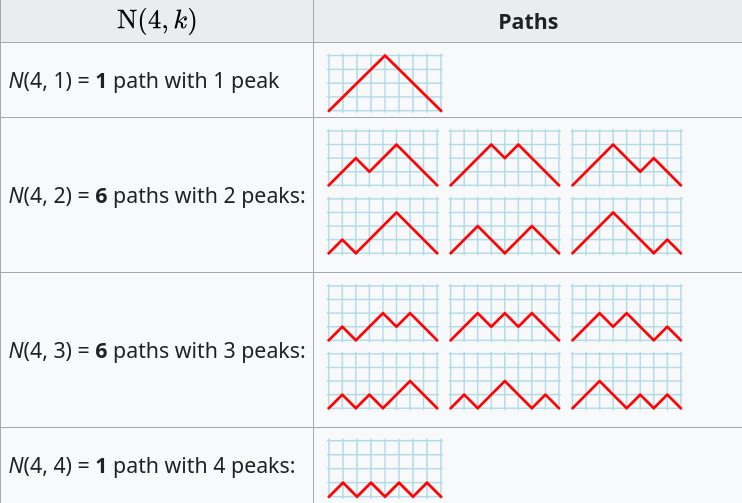
The sum of all these paths is the Catalan number for the given number of if-statements, e.g., using  to denote the Narayana number:
 }=1 + 6 + 6 + 1 = 14=C_4") .
.
Adding at least one simple statement to each innermost if-statement changes the equation for the number of statement sequences from ") , to:
, to:
(matrix{2}{1}{{S-k*P(N, k)} 2*N})}")
The following table shows the number of distinct statement sequences for five-to-twenty statements containing one-to-five if-statements:
                   N if-statements
           1       2       3       4       5
   5       6       1
   6      10       6
   7      15      20       1
   8      21      50       7
   9      28     105      29       1
  10      36     196      91       9
  11      45     336     238      45       1
  12      55     540     549     166      11
S 13      66     825   1,155     504      66
  14      78   1,210   2,262   1,332     286
  15      91   1,716   4,179   3,168   1,002
  16     105   2,366   7,351   6,930   3,014
  17     120   3,185  12,397  14,157   8,074
  18     136   4,200  20,153  27,313  19,734
  19     153   5,440  31,720  50,193  44,759
20 171 6,936 48,517 88,458 95,381 |
The following is an R implementation of the calculation:
Narayana=function(n, k) choose(n, k)*choose(n, k-1)/n

Catalan=function(n) choose(2*n, n)/(n+1)


if_stmt_possible=function(S, N)
{
return(Catalan(N)*choose(S, 2*N)) # allow empty innermost if-statement
}


if_stmt_cnt=function(S, N)
{
if (S <= 2*N)
   return(0)
total=0
for (k in 1:N)
   {
   P=Narayana(N, k)
   if (S-P*k >= 2*N)
      total=total+P*choose(S-P*k, 2*N)
   }

return(total)
}

isc=matrix(nrow=25, ncol=5)

for (S in 5:20)
   for (N in 1:5)
      isc[S, N]=if_stmt_cnt(S, N)

print(isc) |
Comparing expression usage in mathematics and C source
Why does a particular expression appear in source code?
One reason is that the expression is the coded form of a formula from the application domain, e.g.,  .
.
Another reason is that the expression calculates an algorithm/housekeeping related address, or offset, to where a value of interest is held.
Most people (including me, many years ago) think that the majority of source code expressions relate to the application domain, in one-way or another.
Work on a compiler related optimizer, and you will soon learn the truth; most expressions are simple and calculate addresses/offsets. Optimizing compilers would not have much to do, if they only relied on expressions from the application domain (my numbers tool throws something up every now and again).
What are the characteristics of application domain expression?
I like to think of them as being complicated, but that’s because it used to be in my interest for them to be complicated (I used to work on optimizers, which have the potential to make big savings if things are complicated).
Measurements of expressions in scientific papers is needed, but who is going to be interested in measuring the characteristics of mathematical expressions appearing in papers? I’m interested, but not enough to do the work. Then, a few weeks ago I discovered: An Analysis of Mathematical Expressions Used in Practice, by Clare So; an analysis of 20,000 mathematical papers submitted to arXiv between 2000 and 2004.
The following discussion uses the measurements made for my C book, as the representative source code (I keep suggesting that detailed measurements of other languages is needed, but nobody has jumped in and made them, yet).
The table below shows percentage occurrence of operators in expressions. Minus is much more common than plus in mathematical expressions, the opposite of C source; the ‘popularity’ of the relational operators is also reversed.
Operator Mathematics C source = 0.39 3.08 - 0.35 0.19 + 0.24 0.38 <= 0.06 0.04 > 0.041 0.11 < 0.037 0.22 |
The most common single binary operator expression in mathematics is n-1 (the data counts expressions using different variable names as different expressions; yes, n is the most popular variable name, and adding up other uses does not change relative frequency by much). In C source var+int_constant is around twice as common as var-int_constant
The plot below shows the percentage of expressions containing a given number of operators (I’ve made a big assumption about exactly what Clare So is counting; code+data). The operator count starts at two because that is where the count starts for the mathematics data. In C source, around 99% of expressions have less than two operators, so the simple case completely dominates.
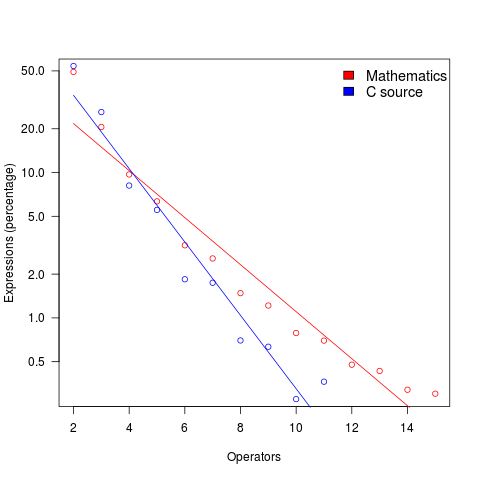
For expressions containing between two and five operators, frequency of occurrence is sort of about the same in mathematics and C, with C frequency decreasing more rapidly. The data disagrees with me again…
Mathematical proofs contain faults, just like software
The idea of proving programs correct, like mathematical proofs, is appealing, but is based on an incorrect assumption often made by non-mathematicians, e.g., mathematical proofs are fault free. In practice, mathematicians make mistakes and create proofs that contain serious errors; those of us who are taught mathematical techniques, but are not mathematicians, only get to see the good stuff that has been checked over many years.
An appreciation that published proofs contain mistakes is starting to grow, but Magnificent mistakes in mathematics is an odd choice for a book title on the topic. Quotes from De Millo’s article on “Social Processes and Proofs of Theorems and Programs” now appear regularly; On proof and progress in mathematics is worth a read.
Are there patterns to the faults that appear in claimed mathematical proofs?
- The difficulty of the problem is one obvious issue, as shown by the faulty proofs of the N vs. NP problem,
- the size of the proof, in number of pages, is a common problem, with Mochizuki’s ‘proof’ of the ABC conjecture being a recent example and the Hales-Ferguson proof of the Kepler conjecture has a whole book dedicated to trying to figure out if the proof is correct,
- number of people involved: some of the 100+ mathematicians responsible for proving components of the classification of finite simple groups died before the proof was claimed to be complete; the proofs of the various components created the largest known claimed proof, at tens of thousands of pages.
A surprisingly common approach, used by mathematicians to avoid faults in their proofs, is to state theorems without giving a formal proof (giving an informal one is given instead). There are plenty of mathematicians who don’t think proofs are a big part of mathematics (various papers from the linked-to book are available as pdfs).
Next time you encounter an advocate of proving programs correct using mathematics, ask them what they think about the uncertainty about claimed mathematical proofs and all the mistakes that have been found in published proofs.
What is the error rate for published mathematical proofs?
Mathematical proofs are sometimes cited as the gold standard against which software quality should be compared. At school we rarely get to hear about proofs that turn out to be wrong and are inculcated with the prevailing wisdom that all mathematical proofs are correct.
There are many technical and social issues involved in believing a published proof and well known established mathematicians have no trouble pointing out that “… it is impossible to write out a very long and complicated argument without error, …”
Examples of incorrect published proofs include Wiles’ first proof of Fermat’s Last Theorem and an serious error found in a proof of a message signing scheme.
A question on mathoverflow contains a list of rather interesting false proofs.
Then, of course, there are always those papers that appear in journals that get written about more frequently on Retraction Watch than others.
What is the error rate for published mathematical proofs? I have not been able to find any collection of mathematical proof error data.
Several authors have expressed the view that because there so many diverse mathematical topics being studied these days there are very few domain experts available to check proofs. A complicated proof of a not particularly interesting result is unlikely to attract the attention needed to check it thoroughly. It should come as no surprise that the number of known errors in such proofs is equal to the number of known errors in programs that have never been executed.
Proofs are different from programs in that one error can be enough to ‘kill-off’ a proof, while a program can contain many errors and still be useful. Do errors in programs get talked about more than errors in proofs? I rarely get to socialize with working mathematicians and so cannot make any judgment call on this question.
Every non-trivial program is likely to contain many errors; can the same be said for long mathematical proofs? Are many of these errors as trivial (in the sense that they are easily fixed) as errors in programs?
One commonly used error rate for programs is errors per line of code; how should the rate be expressed for proofs? Errors per page, per line, per definition?
Lots of questions and I’m hoping one of my well informed readers will be able to provide some answers or at least cite a reference that does.
Abramowitz and Stegun mark II
Like me I imagine many readers have owned a copy of Handbook of Mathematical Functions (or to use its more well known name “Abramowitz and Stegun”, after its two editors). Some time ago I heard that an updated handbook was being created, time passed and last year the “NIST Handbook of Mathematical Functions” was published, the companion web site has been slowing evolving over the years.
I did not hear anybody raving about the updated handbook and it was priced at more than twice that of the original (whose copyright was in the public domain and thus open to Dover to print a low cost edition {and others to make available online}, NIST are claiming copyright over the updated version which is published by Cambridge University press), so did not rush out to buy a copy.
I recently placed a large order with Amazon US and was tempted by a temporary price reduction to buy the NIST handbook (tip for Europeans: it is often possible to make big savings by ordering from amazon.com, which seems to ship from Germany and arrives a few days later than orders placed with amazon.co.uk),
Summary recommendation:
- Should somebody who has the original handbook buy the update? Probably not.
- If somebody had a choice of either, which should they pick? I would go for the original handbook.
The major difference between the handbooks are that the substantial number of precomputed tables of values of functions are not included in the update and there are 12 new chapters covering subjects not included (or not given much prominence) in the original. A not so important difference is the switch from black&white to color in the update, this works well in the online version (on the CD shipped with the book) but works poorly in print form; if a book is intended to be printed its color usage needs to be optimized for reflected light which has different characteristics than the transmitted light of a display..
The argument for removing the tables of values is that software packages can now be used to obtain these. In practice I rarely use the tables of values for this purpose; I use the tables to find the range of function input values that will generate a given rang of output values, or to see how output values change with changes in input values. For me omitting these tables in the update was a big mistake; ok the number of significant digits could have been reduced (to say five) to save some paper. The new chapters often contain various tables of numbers, but they are not extensive, but a conscious decisions seems to have been made to remove tables from existing chapters.
From a user interface point of view I don’t like the glossy paper used in the update, presumably caused by the switch to color which does not work well in the printed version; the angle of the page has to be constantly shifted to reduce glare from overhead lights and the handbook is noticeably heavier even though the page count is down by around 20% (886 vs 1030, excluding index which is substantially improved in the update).
The original has lots of tables, matte pages that don’t glare and is surprisingly light for such a big book. Time will tell whether I find the new chapters useful.
Recent Comments