Archive
Changes in optimization performance of gcc over time
The SPEC benchmarks came out a year after the first release of gcc (in fact gcc was and still is one of the programs included in the benchmark). Compiling the SPEC programs using the gcc option -O2 (sometimes -O3) has always been the way to measure gcc performance, but after 25 years does this way of doing things tell us anything useful?
The short answer: No
The longer answer is below as another draft section from my book Empirical software engineering with R book. As always comments welcome.
Changes in optimization performance of gcc over time
The GNU Compiler Collection <book gcc-man_12> (GCC) is under active development with its most well known component, the C compiler gcc, now over 25 years old. After such a long period of development is the quality of code generated by gcc still improving and if so at what rate? The method typically used to measure compiler performance is to compile the [SPEC] benchmarks with a small set of optimization options switched on (e.g., the O2 or O3 options) and this approach is used for the analysis performed here.
Data
Vladimir N. Makarow measured the performance of 9 releases of gcc, occurring between 2003 and 2010, on the same computer using the same benchmark suite (SPEC2000); this data is used in the following analysis.
The data contains the [SPEC number] (i.e., runtime performance) and code size measurements on 12 integer programs (11 in C and one in C+\+) from SPEC2000 compiled with gcc versions 3.2.3, 3.3.6, 3.4.6, 4.0.4, 4.1.2, 4.2.4, 4.3.1, 4.4.0 and 4.5.0 at optimization levels O2 and O3 (the mtune=pentium4 option was also used) 32-bit for the Intel Pentium 4 processor.
The same integer programs and 14 floating-point programs (10 in Fortran and 4 in C) were compiled for 64-bits, again with the O2 and O3 options (the mpc64 floating-point option was also used), using gcc versions 4.0.4, 4.1.2, 4.2.4, 4.3.1, 4.4.0 and 4.5.0.
Is the data believable?
The following are two fitness-for-purpose issues associated with using programs from SPEC2000 for these measurements:
-
the benchmark is designed for measuring processor performance not
compiler performance, -
many of its programs have been used for compiler benchmarking for
many years and it is likely that gcc has already been tuned to do
well on this benchmark.
The runtime performance measurements were obtained by running each programs once, SPEC requires that each program be run three times and the middle one chosen. Multiple measurements of each program would have increased confidence in their accuracy.
Predictions made in advance
Developers continue to make improvements to gcc and it is hoped that its optimization performance is increasing, knowing that performance is at a steady state or decreasing performance is also of interest.
No hypothesis is proposed for how optimization performance, as measured by the O2 and O3 options, might change between releases of gcc over the period 2003 to 2010.
The gcc documentation says that using the O3 option causes more optimizations to be performed than when the O2 option is used and therefore we would expect better performance for programs compiled with O3.
Applicable techniques
Modelling individual O2 and O3 option performance
One technique for modelling changes in optimization performance is to build a linear model that fits the gcc version (i.e., version is the predictor variable) to the average performance of the code it generate, calculating the averaged performance over each of the programs measured with the corresponding version of gcc. The problem with this approach is that by calculating an average it is throwing away information that is available about the variation in performance across different programs.
Building a [mixed-effects] model would make use of all the data when fitting a relationship between two quantities where there is a recurring random component (i.e., the SPEC program used). The optimizations made are likely to vary between different SPEC programs, we could treat the performance variations caused by difference in optimization as being random and having an impact on the mean performance value of all programs.
Programs differ in the magnitude of their SPEC number and code size, the measurements were converted to the percentage change compared against the values obtained using the earliest version of gcc in the measurement set.
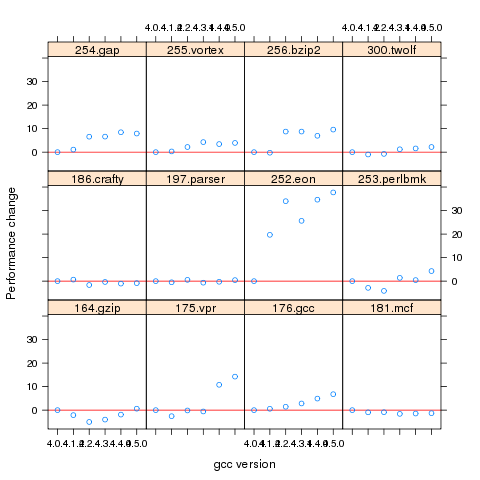
Figure 1. Percentage change in SPEC number (relative to version 4.0.4) for 12 programs compiled using 6 different versions of gcc (compiling to 64-bits with the O3 option).
Fitting a linear model requires at least two sets of [interval data]. The gcc version numbers are [ordinal values] and the following are two possible ways of mapping them to interval values:
-
there have been over 150 different released versions of gcc and a
particular version could be mapped to its place in this sequence. -
the date of release of a version can be mapped to the number of
days since the first release.
If version releases are organized around new functionality added then it makes sense to use version sequence number. If the performance of a new optimization was proportional to the amount of effort (e.g., man days) that went into its implementation then it would make sense to use days between releases.
The versions tested by Makarow were each from a different secondary release within a given primary version line and at roughly yearly intervals (two years separated the first pair and one month another pair).
There have been approximately 25 secondary releases in the 25 year project and using a release version sequence number starting at 20 seems like a reasonable choice.
Internally a compiler optimizer performs many different kinds of optimizations (gcc has over 160 different options for controlling machine independent optimization behavior). While the implementation of a new optimization is a gradual process involving many days of work, from the external user perspective it either exists and does its job when a given optimization level is supported or it does not exist.
What is the shape of the performance/release-version relationship? In the first few years of a compilers development it is to be expected that all the known major (i.e., big impact) optimization will be implemented and thereafter newly added optimizations have a progressively smaller impact on overall performance. Given gcc’s maturity it looks reasonable to assume that new releases contain a few additional improvement that have an incremental impact, i.e., the performance/release-version relationship is assumed to be linear (no other relationship springs out of a plot of the data).
A mixed-effects model can be created by calling the R function lme from the package nlme. The only difference between the following call to lme and a call to lm is the third argument specifying the random component.
t.lme=lme(value ~ variable, data=lme.O2, random = ~ 1 | Name) |
The argument random = ~ 1 | Name specifies that the random component effects the mean value of the result (when building a model this translates to an effect on the value of the intercept of the fitted equation) and that Name (of the program) is the grouped variable.
To specify that the random effect applies to the slope of the equation rather than its intercept the call is as follows:
t.lme=lme(value ~ variable, data=lme.O2, random = ~ variable -1 | Name) |
To specify that both the slope and the intercept are effected the -1 is omitted (for this gcc data the calculation fails to converge when both can be effected).
Since the measurements are about different versions of gcc it is to be expected that the data format has a separate column for each version of gcc (the format that would be used to pass data lm) as follows:
Name v3.2.3 v3.3.6 v3.4.6 v4.0.4 v4.1.2 v4.2.4 v4.3.1 v4.4.0 v4.5.0 1 164.gzip 933 932 957 922 933 939 917 969 955 2 175.vpr 562 561 577 576 586 585 576 589 588 3 176.gcc 1087 1084 1159 1135 1133 1102 1146 1189 1211 |
The relationship between the three variables in the call to lme is more complicated and the data needs to be reorganize so that one column contains all of the values, one the gcc version numbers and another column the program names. The function melt from package reshape2 can be used to restructure the data to look like:
Name variable value 11 256.bzip2 v3.2.3 0.000000 12 300.twolf v3.2.3 0.000000 13 SPECint2000 v3.2.3 0.000000 14 164.gzip v3.3.6 -0.107181 15 175.vpr v3.3.6 -0.177936 16 176.gcc v3.3.6 -0.275989 17 181.mcf v3.3.6 0.148810 |
Comparing O2 and O3 option performance
When comparing two samples the [Wilcoxon signed-rank test] and the [Mann-Whitney U test] spring to mind. However, some of the expected characteristics of the data violate some of the properties that these tests assume hold (e.g., every release include new/updated optimizations which is likely to result in the performance of each release having a different mean and variance).
The difference in performance between the two optimization levels could be treated as a set of values that could be modelled using the same techniques applied above. If the resulting model have a line than ran parallel with the x-axis and was within the appropriate confidence bounds we could claim that there was no measurable difference between the two options.
Results
The following is the output produced by summary for a mixed-effect model, with the random variation assumed to effect the value of intercept, created from the SPEC numbers for the integer programs compiled for 64-bit code at optimization level O2:
Linear mixed-effects model fit by REML
 Data: lme.O2
       AIC      BIC    logLik
  453.4221 462.4161 -222.7111

Random effects:
 Formula: ~1 | Name
        (Intercept) Residual
StdDev:    7.075923 4.358671

Fixed effects: value ~ variable
                 Value Std.Error DF   t-value p-value
(Intercept) -29.746927  7.375398 59 -4.033264   2e-04
variable      1.412632  0.300777 59  4.696612   0e+00
 Correlation:
         (Intr)
variable -0.958

Standardized Within-Group Residuals:
        Min          Q1         Med          Q3         Max
-4.68930170 -0.45549280 -0.03469526  0.31439727  2.45898648

Number of Observations: 72
Number of Groups: 12
|
and the following summary output is from a linear model built from an average of the data used above.
Call:
lm(formula = value ~ variable, data = lmO2)

Residuals:
      13       26       39       52       65       78
 0.16961 -0.32719  0.47820 -0.47819 -0.01751  0.17508

Coefficients:
             Estimate Std. Error t value Pr(>|t|)
(Intercept) -28.29676    2.22483  -12.72 0.000220 ***
variable      1.33939    0.09442   14.19 0.000143 ***
---
Signif. codes:  0 ‘***’ 0.001 ‘**’ 0.01 ‘*’ 0.05 ‘.’ 0.1 ‘ ’ 1

Residual standard error: 0.395 on 4 degrees of freedom
Multiple R-squared: 0.9805,     Adjusted R-squared: 0.9756
F-statistic: 201.2 on 1 and 4 DF,  p-value: 0.0001434
|
The biggest difference is that the fitted values for the Intercept and slope (the column name, variable, gives this value) have a standard error that is 3+ times greater for the mixed-effects model compared to the linear model based on using average values (a similar result is obtained if the mixed-effects random variation is assumed to effect the slope and the calculation fails to converge if the variation is on both intercept and slope). One consequence of building a linear model based on averaged values is that some of the variations present in the data are smoothed out. The mixed-effects model is more accurate in that it takes all variations present in the data into account.
For integer programs compiled for 32-bits there is much less difference between the mixed-effects models and linear models than is seen for 64-bit code.
-
For SPEC performance the created models show:
-
for the integer programs a rate of increase of around 0.6% (sd
0.2) per release forO2andO3options on 32-bit code
and an increase of 1.4% (sd 0.3) for 64-bit code, -
for floating-point, C programs only, a rate of increase per
release of 12% (sd 5) at 32-bits and 1.4% (sd 0.7) at 64-bits, with
very little difference between theO2andO3options.
-
for the integer programs a rate of increase of around 0.6% (sd
-
For size of generated code the created models show:
-
for integer programs 32-bit code built using
O2size is
decreasing at the rate of 0.6% (sd 0.1) per release, while for both
64-bit code andO3the size is increasing at between 0.7% (sd
0.2) and 2.5% (sd 0.4) per release, -
for floating-point, C programs only, 32-bit code built using
O2had an unacceptable p-value, while for both 64-bit code
andO3the size is increasing at between 1.6% (sd 0.3) and
9.3 (sd 1.1) per release.
-
for integer programs 32-bit code built using
Comparing O2 and O3 option performance
The intercept and slope values for the models built for the SPEC integer performance difference had p-values way too large to be of interest (a ballpark estimate of the values would suggest very little performance difference between the two options).
The program size change models showed O3 increasing, relative to O2, at 1.4% to 1.7% per release.
Discussion
The average rate of increase in SPEC number is very low and does not appear to be worth bothering about, possible reasons for this include:
-
a lot of effort has already been invested in making sure that gcc
performs well on the SPEC programs and the optimizations now being
added to gcc are aimed at programs having other kinds of
characteristics, -
gcc is a mature compiler that has implemented all of the worthwhile
optimizations and there are no more major improvements left to be
made, -
measurements based on just setting the
O2orO3
options might not provide a reliable guide to gcc optimization
performance. The command
gcc -c -Q -O2 --help=optimizers
shows that for gcc version 4.5.0 theO2option enables 91 of
the possible 174 optimization options and theO3option
enables 7 more. Performing some optimizations together sometimes
results in poorer quality code than if a subset of those
optimizations had been applied (genetic programming is being
researched as one technique for selecting the best optimizations
options to use for a given program and up to 13% improvements have
been obtained over gcc’s -O options <book Bashkansky_07>). The
percentage performance change figure above shows
that for some programs performance decreases on some releases.Whole program optimization is a major optimization area that has been addressed in recent versions of gcc, this optimizations is not enabled by the
Ooptions.
The percentage differences in SPEC integer performance between the O2 and O3 options were very small, but varied too much to be able to build a reliable linear model from the values.
For SPEC program code size there is a significant different between the O2 and O3 options. This is probably explained by function inlining being one of the seven additional optimization enabled by O3 (inlining multiple calls to the same function often increases code size <book inlining> and changes to the inlining optimization over releases could result in more functions being inlined).
Conclusion
Either the optimizations added to gcc between 2003 and 2010 have not made any significant difference to the performance of the generated code or the established method of measuring gcc optimization performance (i.e., the SPEC benchmarks and the O2 or O3 compiler options) is no longer a reliable indicator.
Descriptive statistics of some Agile feature characteristics
The purpose of software engineering research is to figure out how software development works so that the software industry can improve its quality/timeliness (i.e., lower costs and improved customer satisfaction). Research is hampered by the fact that companies are not usually willing to make public good quality data about the details of their software development processes.
In mid July a post on the ACCU general mailing list caught my eye and I followed a link to a very interesting report, went to visit 7digital a few weeks later, told them about my empirical software engineering with R book and how I wanted to make all the data I used available to readers and they agreed to make the data public! The data arrived at the start of August and I spent the rest of the month analyzing it (the R code I used to analyse it).
Below is a draft of what will eventually appear in the book. As always comments welcome, particularly if you can extract more information from the 7digital data (the mapping of material to WordPress blog format might still be flaky in places).
Agile feature characteristics
Traditionally software development projects work towards releasing product updates on prespecified dates, often with a release cycle of between once or twice a year and with many updates included in each release. In contrast to this approach development groups following an Agile method <book ???> make frequent releases with each containing a small incremental update (Agile is an umbrella term applied to a variety of iterative and incremental software development methodologies).
Rationale for the Agile approach includes getting rapid feedback from customers on the direction of developments and maximizing return on software investment by getting newly implemented features into customers hand almost immediately.
The large number of releases (compared to other approaches) has the potential to provide enough data for meaningful statistical analysis of questions such as how often new features are released and the number of features under development at any time.
7digital<book 7Digital_12> is a digital media delivery company that operates an international on-line digital music store (www.7digital.com) and provides business to business digital media services via an open API platform. At 7digital software development is done using an Agile process and since April 2009 various items of information have been recorded <book Bowley_12>; 7digital are open about there process and have made this information publicly available and it is analysed here.
Data
The data consists of information on the 3,238 features implemented by the 7digital team between April 2009 and July 2012; this information consists of three dates (Prioritised/Start Development/Done), a classification of the feature as one of nine possible internal types (i.e.,
During the recording period the number of developers grew from 14 to 35.
The start/done dates represent an elapsed time period, a wide variety of factors can cause work on the implementation of a feature to be stalled for a period of time, i.e., the time difference need not represent total development time.
The Agile process gives a great deal of flexibility to developers about which projects they chose to work on. Information on the number of developers working on the implementation of individual features was not recorded.
Is the data believable?
As discussed elsewhere [checking data quality] measurements involving people are likely to be subject more external influences than measurements of inanimate objects such as source code, they are also more difficult to replicate and are open to those being measured influencing the results in their favor.
The following is what is known about the 7digital measurement process.
The data recording was done by whoever ran the Agile stand-up session at the start of the day.
What unit of time measurement is appropriate for analysing an Agile process? While fine grained measurements are the ideal they have the potential to require nontrivial effort from those reporting the values, are open to individual interpretation (e.g., when exactly did work start/stop on this feature?) and subject to human error (e.g., forgetting to note the event when it happened and having to recall it later). The day was chosen as the basic unit of time measurement; in light of the time needed to implement most features this may seem too large, but this choice has the advantage of being the natural unit of measurement in that developers meet together every morning to discuss progress and that days work and being so broad makes it more likely that start/end times will be consistently applied as well as less prone to inaccurate recall later.
Goodhart’s law (it is really an observation of human behavior rather than a law) says “Any observed statistical regularity will tend to collapse once pressure is placed on it for control purposes.” If the measurements collected were actively used to control or evaluate the development team then the developers would be motivated to move the measurements in the direction that was favorable to them. 7digital do not attempt to use the measurements for control or evaluation or developers and developers have no motive change their behavior based on being measured.
I find the data believable in that the measurement process is not so expensive or cumbersome that developers are unwilling to attempt to report accurate data and not being directly effected by the results means they have no motive for changing their behavior to influence the measurements.
Believable data does not mean the data is error free. The following is a count of the days of the week on which feature implementations were recorded as being Done. Monday is day 0 and the counts for Saturday/Sunday should be zero; assuming that Friday/Monday had been intended the non-zero values suggest a 2-4% error rate, comparable with human error rates for low stress/non-critical work.
> table(Done.day[(Done.day <= 650)] %% 7) 0 1 2 3 4 5 6 227 225 214 243 177 8 7 > table(Done.day[(Done.day > 650)] %% 7) 0 1 2 3 4 5 6 443 483 455 473 270 4 9 |
Predictions made in advance
Your author is not aware of any empirically based theory of Agile feature development capable of making predictions about development time related questions.
The analysis described here is purely descriptive; there is no attempt to build predictive models or compare the data against any existing theory.
The results from this data analysis (and all analysis in this book) are to provide information that will help software developers do a better job. What information can be extracted that would be useful to 7digital? This has proved to be a something of a chicken-and-egg question because people are interested in seeing the results before deciding whether they are useful. The following issues are of general interest:
- characteristics of the time taken to implement new features,
- variations in the number of different kinds of features (e.g., bug/non-bug) over time,
Applicable techniques
Overview of data
The data consists of start/finish times for the implementations of features and the overview information that springs to mind is average number of features implementation starts per time interval and average time taken to implement a feature. The figure below is a good enough approximation to this information to get a rough idea of its characteristics (e.g., the effect of weekends and holidays have not been taken into account and a 30 day rolling mean has been applied to smooth out daily fluctuations).
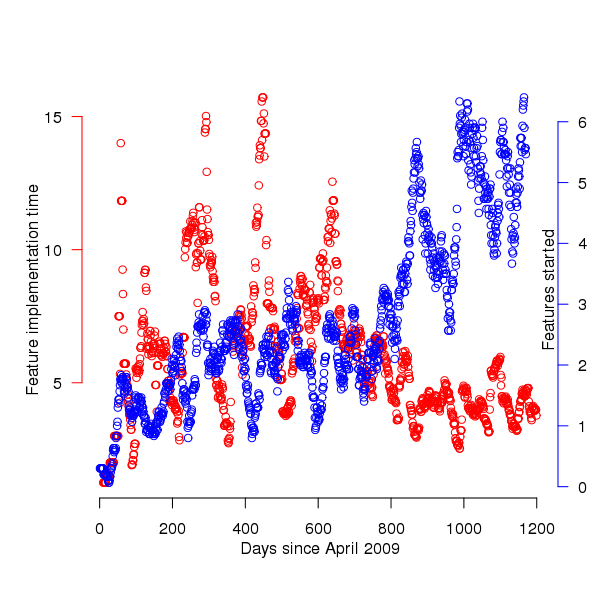
Figure 1. Average number of feature implementations started (blue) and their average duration (red); a 30 day rolling mean has been applied to both. Data courtesy of 7digital.
The plot appears to have two parts, before and after day 650 (or thereabouts). After day 650 the oscillations in feature implementation time die down substantially and the rate at which new feature implementations are started steadily increases. Possible reasons for the larger variations in the first 650 days include less expertise in organizing features into smaller work items and larger features being needed during the earlier stages of product development.
Obviously shorter implementation times make it possible to start work on more new features, however new feature starts continues to increase while implementation time stabilises around a lower value. Possible causes for the continuing increase in new feature starts include an increase in the number of developers and/or existing developers becoming more skilled in breaking work down into smaller features (i.e., feature implementation time stays about the same because fewer developers are working on each feature, making developers available to start on new features).
Software product development is a complicated business and a wide variety of different events and processes are likely to have contributed to the patterns of behavior seen in the data. While developers write the software it is customers who report most of the bugs and one of the goals of following an Agile methodology is rapid response to customer feedback (e.g., deciding which features need to be implemented and which left out). Customer information is not present in the dataset.
Are the same processes generating the apparent two phase behavior?
Any pattern of behavior is generated by a set of processes and when a pattern of behavior changes it is worthwhile asking how the processes driving the behavior changed.
Fitting a statistical distribution to a dataset is useful in that many distributions are known to be generated by processes having specified behaviors. Being able to fit the same distribution to both the pre and post 650 day datasets suggests that the phase change seen was not a fundamental change but akin to turning the volume knob of the distribution parameters one way or the other. If the datasets are best fitted by different distributions then the processes generating the two patterns of behavior are potentially very different.
Of the two characteristics plotted the feature implementation time appears to undergo the largest change of behavior and so the distribution of implementation times for the two phases is analysed here.
| Moment | Initial 650 days | After 650 days |
|---|---|---|
|
Median
|
3
|
3
|
|
Mean
|
7.6
|
4.6
|
|
Variance
|
116.4
|
35.0
|
|
Skewness
|
3.3
|
4.9
|
|
Kurtosis
|
19.2
|
30.4
|
A quick look at the data shows that many features are implemented in a single day and only a few take more than a week, one distribution having this pattern of behavior is the power-law. The table above shows that the variance is much larger than the mean and the distribution has a large positive skew, properties shared by the [negative binomial distribution]. The figure below is a plot of the number of features requiring a given number of elapsed working days for their implementation (top first 650 days, all features finished after 650 days), along with two power-law and a negative binomial distribution fit to the data.
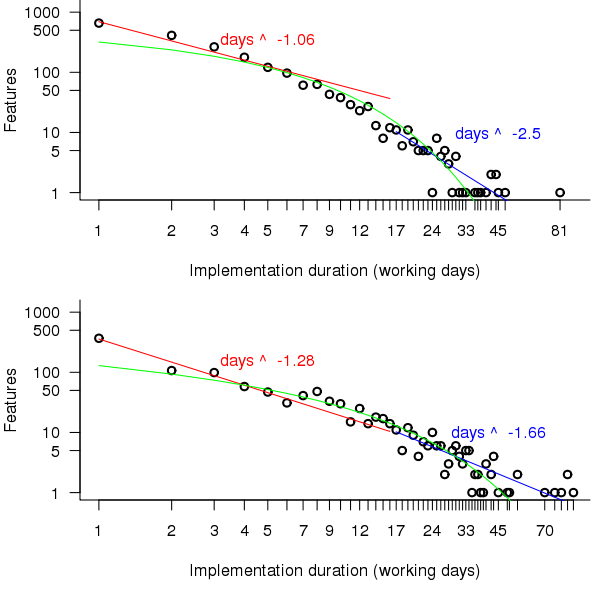
Figure 2. Number of features whose implementation took a given number of elapsed workdays. Top first 650 days, bottom after 650 days. Green line is the fitted negative binomial distribution. Data courtesy of 7digital.
The power-law fits were obtained by splitting the data into two parts, shorter/longer than 16 days (after noticing that visually the combined dataset seemed to have this form, less noticeable in the two subsets) and performing nonlinear regression using nls to find good fits for the parameters a and b (whose initial starting values converged without needing manual tuning).
pow_equ=nls(num.features ~ a*days^b, start=list(a=1200, b =-2)) y=predict(pow_equ, days) lines(days, y) |
While the power-law fits are not very good overall one of them does provide an easy to remember seat of the pants method for approximating the probability of a project taking a small number of days to complete (e.g., for  it is
it is 
[sum(1/(1:16)) is 3.38]). The approximation is also a reasonable fit for subsets of the features (e.g., different kinds of bugs).
The R package fitdistrplus contains functions for matching and fitting a dataset against known commonly occurring distribution. The Cullen and Frey graph produced by a call to descdist suggests that a negative binomial distribution is the best fitting of those tested (agreeing with the ad-hoc conclusion jumped to above).
descdist(p\$Cycle.Time, discrete=TRUE, boot=100) |
The function fitdist returns values for the parameters providing the appropriate fit to the specified dataset and distribution.
fd=fitdist(p\$Cycle.Time, "nbinom", method="mle") # Fit to a negative binomial distribution size.ct=fd\$estimate[1] mu.ct=fd\$estimate[2] # Plot distribution using fitted parameters plot(dnbinom(1:93, size=size.ct, mu=mu.ct)*length(p\$Cycle.Time), xlim=c(1,90), ylim=c(1,1200), log="xy") |
The figure above shows that the negative binomial distribution could be a reasonable fit if the percentage of single day features was not so high. Two possibilities spring to mind:
- the data does not include any counts for zero days which is one of the possible values supported by the negative binomial distribution (obviously feature implementations cannot take zero days),
- measurement quantization introduces significant uncertainty for shorter implementations, if the minimum unit of measurement were less than 1 day the fit might be much better because some feature implementations take half-a-day while others take a whole day.
It is possible to adjust the negative binomial equation to move the lower bound from zero to one. The package gamlss supports what is known as zero-truncation and the figure below shows the zero-truncated negative binomial distribution fitted to the pre/post 650 day counts.
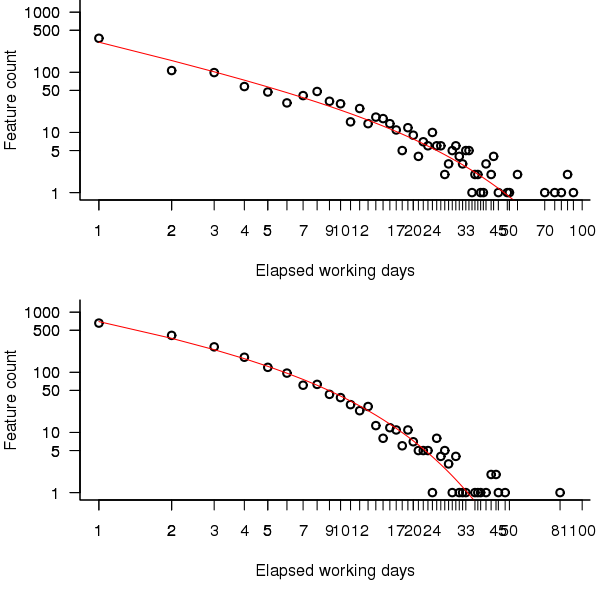
Figure 3. A zero-truncated negative binomial distribution fitted to the number of features whose implementation took a given number of elapsed workdays; top first 650 days, bottom after 650 days. Data courtesy of 7digital.
The quality of fit is much better for the pre 650 day data compared to the post 650 data.
> qual.pre650 AIC log.likelihood 6109.225 -3052.612 > qual.post650 AIC log.likelihood 9923.509 -4959.754 |
Modifying the negative binomial distribution to handle a dataset not containing zeroes improves the fit, can the fit be further improved by adjusting for measurement quantization?
One possibility is to simulate measuring feature implementation in units smaller than a day; the following code multiplies the implementation time by two and randomly decides whether to subtract one, i.e., maps measurements made in days to a possible set of measurements made in half days.
num.features=length(cycle.time) dither=as.integer(runif(num.features, 0, 1) > 0.33) return(2*cycle.time-dither) |
Fitting 1,000 randomly modified half-day measurements and averaging over all results shows that the fit is slightly worse than the original data (as measured by various goodness of fit criteria):
> fit.quality(p\$Cycle.Time[Done.day < 650]) loglikelihood AIC BIC -3438.284 6880.567 6890.575 > rowMeans(replicate(1000, fit.quality(sub.divide(p\$Cycle.Time[Done.day < 650])))) loglikelihood AIC BIC -4072.721 8149.442 8159.450 |
As discussed in the section on [properties of distributions] the negative binomial distribution can be generated by a mixture of [Poisson distribution]s whose means have a [Gamma distribution]. There are other distributions that can be generated through a mixture of Poisson distributions, are any of them a better fit of the data? The Delaporte distribution <book ???> sometimes fits very slightly better and sometimes slightly worse (see chapter source code for details); the difference is not large enough to warrant switching from a relatively well known distribution to one that is rarely covered in text books or supported in software; if data from other projects is best fitted by a Delaporte distribution then a switch may well be worthwhile.
The data subset corresponding to p$Type == "Production Bug" fits significantly better than the complete dataset (i.e., AIC = 3729) while the fit for the subset p$Type == "MMF" is comparable to the complete dataset (i.e., AIC of 7251).
Both datsets appear to follow the same distribution, the negative binomial distribution (with zero-truncation), with the initial 650 days having a greater mean and variance than post 650 days. The Poisson distribution is often encountered in processes involving events in time and one can imagine it applying to the various processes involved in the implementation of a feature; why the means of these Poisson distributions might follow a Gamma distribution is harder to fathom and is left for another day (it implies that both the Poisson means are decreasing and that the variance of the means is decreasing)
Do any other equations fit the data? Given enough optional parameters it is always possible to find an equation that is a good fit to the data. The following call to nls shows that the equation 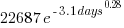 fits the complete dataset rather well.
exp_mod=nls(num.features ~ a*exp(b*days^c), start=list(a=10000, b=-2.0, c=0.4)) |
This equation is unappealing because of its lack of similarity with equations seen in many other areas of research, an exponential whose exponent has the form of  raised to a fractional power is rarely encountered. There is a great deal of uncertainty when analysing data for the first time and being able to fit a form of equation used by other researchers provides a big comfort factor.
How many new feature implementations are started on each day?
The table below give the probability of a given number of new feature implementations starting on any day. There are sufficient multi-day implementations that on almost 20% of days no new feature implementations are started. An exponential equation is the commonly encountered form that provides an approximate fit to these values (i.e., 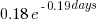 ).
).
| 0 | 1 | 2 | 3 | 4 | 5 | 6 | 7 | 8 | 9 |
|---|---|---|---|---|---|---|---|---|---|
|
0.18
|
0.12
|
0.15
|
0.1
|
0.099
|
0.081
|
0.076
|
0.043
|
0.033
|
0.029
|
Time dependent patterns in the data
7digital is a growing company and we would expect that the rate of creation of features would increase over time, also as the size of the code base and the customer base increases the rate at which bugs are accepted for fixing is likely to increase.
The number of features developments started per day is one way of comparing different types of features. Plotting this information (see top left) shows that there is a great deal of variation over very short periods of time. This variation can be smoothed using a [rolling mean] to bring out the trends (the rollmean function in package zoo); the other plots show 20, 50 and 120 day rolling means for bugs (red) and non-bugs (blue) and the non-bug/bug feature ratio (black).
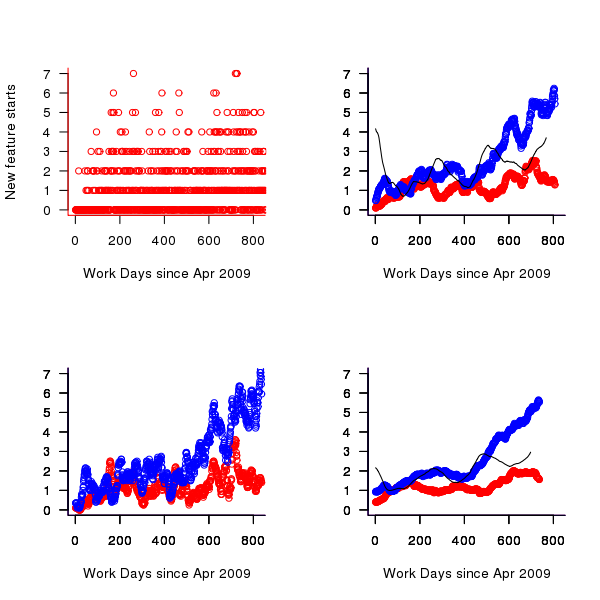
Figure 4. Number of feature developments started on a given work day (red bug fixes, blue non-bug work, black ratio of two values; 20 day rolling mean bottom left, 50 day top right, 120 day bottom right).
Both the number of bugs and non-bug features has trended upwards, as has the ratio between them. While it is tempting to suggest that this increase has been generated by the significant increase in number of developers over the time period, it is also possible the group has become better at dividing work into smaller feature work items or that having implemented the basic core of the products less work is now needed to create new features. The information present in the data is not sufficient to attempt to provide believable explanations for the upward trend.
Time series analysis
A preliminary data analysis technique for time data is to plot the current values against their lagged values for various lags. The output from the R function lag.plot for the number of in-progress features is shown below; apart from clustering the plots do not show any noticeable relationships in the data.
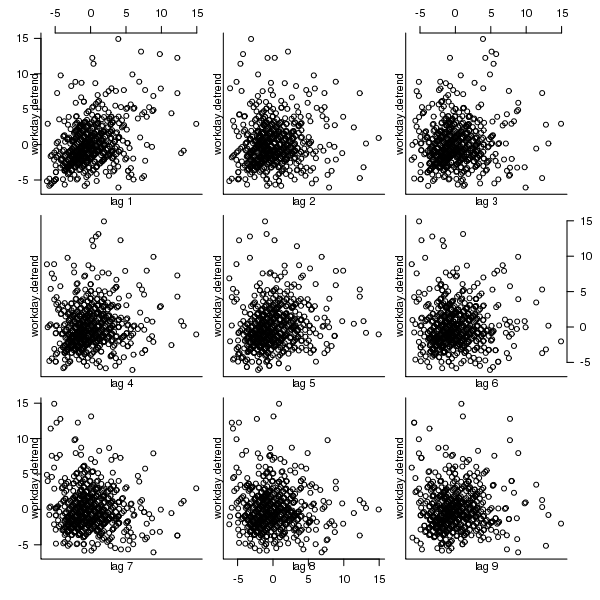
Figure 5. Scatterplot of number of features currently in-progress against various time lags (in working days).
Over longer timescales do the number of in-progress feature implementations have noticeable seasonal variations (e.g., greater in summer and Christmas/year year when developers are likely to be away)?
[Autocorrelation] is the cross-correlation of a time varying signal with itself, i.e., the correlation between a measurement occurring at time  and another one occurring at time
  ; changes in correlation as
  increases can be used to infer information about periodic changes over time.
The number of in-progress features appears to be increasing over time (top left of figure below) and this trend away from zero needs to be adjusted for before an autocorrelation is calculated. The feature implementation recording process did not happen over night and took a while before it covered all work performed; comparing a linear fit of all data (pink line of top left of figure below) and all data from January 2010 (red line) shows that this startup period does not significantly bias the growth trend. However, it is possible that patterns of behavior present in the total set of work items over a period are not reflected in the first 250 days of recording (roughly 180 working days) and so these are excluded from this particular analysis. From feature duration measurements we know that over 70% of features take longer than a day to implement, so the data contains a lot of serial dependence which may affect the accuracy of the results.
trend=lm(day.totals ~ time(day.totals)) plot(day.totals, xlab="Days since Apr 2009", ylab="Features in-progress") abline(trend) day.detrend=day.totals - predict(trend) # Subtract out any global trend |
The bottom left of the figure below shows the variation of in-progress features about the trend line. The top right shows the autocorrelation function for this plot, the regular spikes are caused by weekends (when no work took place). Removing weekends from the analysis results in the autocorrelation shown in the bottom right.
Apart from some correlation having a one day lag the autocorrelation drops to zero almost immediately followed by what appear to be small random spikes. These small spikes do not look important enough to follow up. A very similar pattern is seen in the autocorrelation of the two 650-day phases (the initial 650 days has a larger correlation for lags of 2-5 days). It is possible that a seasonal oscillation in feature work exists but is not seen because the data is so noisy (i.e., contains significant variation between adjacent days).
Summing daily values to create weekly totals, which of provides some smoothing, and performing the above analysis again produces essentially the same results.
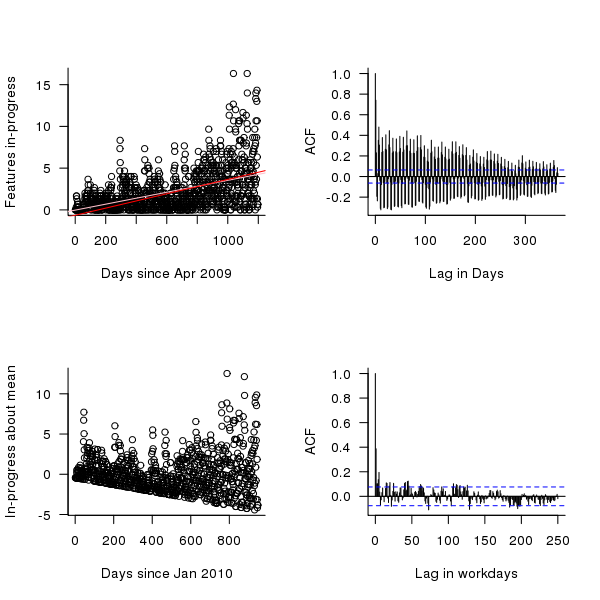
Figure 6. The number of features currently in-production on a given day since April 2009 (top left, pink line is a linear fit of all data, red line a linear fit of the data after day 250), the variation in this number about a linear trend line, excluding the first 250 days (bottom left), the autocorrelation function (top right) and the autocorrelation function with weekends removed from the data (bottom right).
Do reported bugs correlate with new feature releases?
When a feature is released the probability of a new bug being reported increases. Whether different bug probabilities should be assigned to bugfix releases and non-bugfix releases is discussed below. Based on this expectation we would expect to see a [cross correlation] between releases and number of bugs accepted for fixing. The more code a feature contains the more likely it is to contain a bug; however, no information on feature code size is provided so number of implementation work days is used as a measure of feature size.
The data does not specify which bugs belong to which features. It is to be expected that over time the probability of a bug being reported against a feature will decrease, reasons for this behavior include bugfixing, customers no longer using a feature and features being superseded by newer ones.
The figure below is the cross correlation between the ‘size’ of all features recorded as Done on a given day and all bugs recorded as Prioritised on a given date; the top plot is for all non-bugfix feature releases while the bottom plot is for all feature releases.
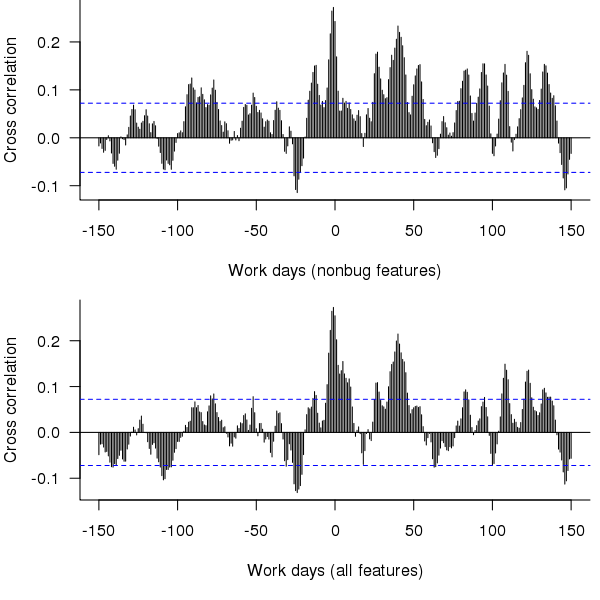
Figure 7. Cross correlation of feature release ‘size’ (top non-bugfix releases, bottom all releases) and date when bugs are prioritised.
The feature/bug cross correlation in the figure above should be zero for negative lags (i.e., no bugs can be reported for features that have not yet been released). One way of interpreting the pattern of correlation is that there some bugs are reported immediately after the release (perhaps by early adopters) followed by more bugs some 20 to 50 working days after release; other interpretations include there being a small amount of signal just visible behind lots of noise in the data or that the approximation used to estimate feature size is too crude.
Using weekly totals produces essentially the same result.
Summary of findings
The distribution of feature implementation times appears to follow a negative binomial distribution (with zero-truncation), with the values for the initial 650 days having a greater mean and variability (i.e., variance) than the following days.
There appears to be too much noise in the data for any time series signal involving mean values or a relationship between releases and bugs to be reliably extracted.
Acknowledgements
Thanks to 7digital for making the data available and being willing to make it public and to Rob Bowley for helping me to understand 7digital’s development environment.
The oldest compiler still in production use is?
What is the oldest compiler still in production use?
A CHILL compiler I worked on a long time ago has probably been in production use for 30 years now.
Code gets added and deleted from production software all the time, how might ‘oldest’ be measured? I propose using the mean age of every line of code, including comments, where the age of a line is reset to zero when it is modified in any way (excluding code formatting).
The following are two environmental factors that enable a production compiler to get very old:
- a relatively obscure language: popular languages have new compilers written for them (compiler death through competition) or have new features added to them (requiring new lines of code which could even displace ‘aged’ code),
- a very long-lived application associated with the language: obscure languages tend to be very quickly abandoned in the dust of history unless they have a symbiotic relationship with an important application,
- very long-lived host hardware and target processor: changing either often requires substantial new code or a move to a newer compiler. For ancient the only candidate is the IBM 370 and just really old the Intel 80×80, Zilog Z80.
Virtual machines provide a mechanism to be host hardware independent. The Micro Focus Cobol had a rewrite in the early 1990s (it might have had others since) and I don’t think UCSD Pascal I.5 is still used for production work.
Fortran is an evolving language and very popular in some application domains. I doubt there are any (mean age) old Fortran compilers in production use.
Why do I put forward the ITT (in its International Telephone & Telegraph days, these bits subsequently sold off) CHILL compiler as potentially the oldest compiler currently in production use?
- Obscure language and long-lived application (telephone switching software),
- host hardware was IBM 370 family, target processor Intel 8086 (later updated to support 80386),
- large development team and very small support team (i.e., lots of old code and small changes over the years),
- single customer, i.e., no push to add features to attract new customers or keep existing ones.
My last conversation with anybody associated with this compiler was a chance meeting over 10 years ago, so I might be a bit out of date.
30+ year old source code for compilers can be downloaded (e.g., the original PDP 11 C compiler) but these compilers are not in production use (forgotten about military installations anybody?)
I welcome other proposals for the oldest compiler currently in production use.
Writing language standards is a cottage industry
In the beginning programming language standards were written by one country’s National Standards body (e.g., ANSI did C/Cobol/Fortran for the USA and BSI did Pascal for the UK) and other countries were free to write their own version, adopt the existing work or do nothing (I don’t know of any country writing their own version, a few countries sometimes stuck their own front page on an existing document and the majority did nothing; update 4 Dec 2012, thanks to David Muxworthy for pointing out that around 1974 the UK, US, Japan and ECMA were all independently developing a standard for BASIC, by 1982 this had evolved to just ANSI and ECMA).
The UK people who created the Pascal Standard wanted the rest of the world (i.e., the US) to adopt it, and the way to do this was to have it adopted as an ISO Standard. The experience of making this happen convinced the folk at BSI that in future, language standards should be produced as an international effort within ISO (those pesky Americans wanted changes made to the document before they would vote for it).
During the creation of the first C Standard various people from Europe joined the ANSI committee, X3J11, so they could take part. Initially the US members were not receptive to the European request for a mechanism to handle keyboards that did not contain certain characters (e.g., left/right square brackets) but responded promptly on hearing that those (pesky) Europeans planned to publish an ISO C Standard that would contain those changes to the ANSI Standard needed to support trigraphs; the published ANSI Standard included support for trigraphs. The C ANSI committee were very receptive to the idea of future work being done at the ISO level; Bill Plauger/Tom Plum did a lot of good work to ensure it happened.
The C++ language came along and long story short an ISO committee was set up to create an ISO Standard for it, then Java came along and the Java Study Group failed to become an ISO committee and then various non-specific language committees happened.
A look at the SC22 website shows that ISO Standards exist for Forth and ECMAscript (it has not yet been updated to include Ruby) with no corresponding ISO committees. What is going on?
One could be cynical and say that special interests are getting a document of their choosing accepted by ECMA and then abusing the ISO fast track procedure to sidestep the need to set up an international committee that has the authority to create a document of its choosing. The reality is that unless a language is very widely used by lots of people (e.g., in the top five or so most commonly used languages) there are unlikely to be enough people (or employers) willing and able to commit the time and money needed to be actively involved in an ISO Standard committee.
Once a document has been fast tracked to become ISO Standard, any updates to it are supposed to be carried out under ISO rules (i.e., an ISO committee). In practice this is not happening with ECMAscript which continues to be very active (I don’t know what is happening with Forth or how the Ruby people plan to handle any updates), holding bi-monthly meetings; over the years they have fast tracked two revisions to the original fast tracked document (the UK did raise the issue during balloting but nothing came of it, I don’t think anybody really cares).
Would moving the ECMAscript development work from ECMA to ISO make a worthwhile difference? There might be a few people out there who would attend an ISO meeting who are not currently attending ECMA meetings (to join ECMA companies with five or fewer employees pay an annual fee of 3,500 Swiss francs {about the same number of US dollars} and larger companies pay a lot more) but I suspect the number would not be large enough to make up for the extra hassle of running an ISO committee (e.g., longer ISO balloting timescales).
Production of programming language standards is really a cottage industry that relies on friends in high places (e.g., companies with an existing membership of ECMA or connections into the local country standards’ body) for them to appear on the international stage.
My no loops in R hair shirt
Being professionally involved with analyzing source code, I get to work with a much larger number of programming languages than most people. There is a huge difference between knowing the intricate details of the semantics of a language and being able to fluently program in a language like a native developer. There are languages whose semantics I probably know better than nearly all its users and yet can only code in like a novice, and there are languages whose reference manual I might have read once and yet can write fluently.
I try not to learn new languages in which to write programs, they just clutter my brain. It can be very embarrassing having somebody sitting next to me while I write an example and not be able to remember whether the language I am using requires a then in its if-statement or getting the details of a print statement wrong; I am supposed to be a computer language expert.
Having decided to migrate from being a casual R user to being a native user (my current status is somebody who owns more than 10 books that make extensive use of R) I resolved to invest the extra time needed to learn how to write code the ‘R-way’ (eighteen months later I’m not sure that there is an ‘R way’ in the sense that could be said to exist in other languages, or if there is it is rather diffuse). One of my self-appointed R-way rules is that any operation involving every element of a vector should be performed using whole vector operations (i.e., no looping constructs).
Today I was analyzing the release history of the Linux kernel and wanted to get the list of release dates for the current version of the major branch; I had a list of dates for every release. The problem is that when a major release branch is started previous branches, now in support only mode, may continue to be maintained for some time, for instance after the version 2.3 branch was created the version 2.2 branch continued to have releases made for it for another five years.
The obvious solution to removing non-applicable versions from the release list is to sort on release date and then loop through the elements, removing those whose version number was less than the version appearing before them in the list. In the following excerpt the release of 2.3.0 causes the following 2.2.9 release to be removed from the list, also versions 2.0.37 and 2.2.10 should be removed.
Version Release_date 2.2.8 1999-05-11 2.3.0 1999-05-11 2.2.9 1999-05-13 2.3.1 1999-05-14 2.3.2 1999-05-15 2.3.3 1999-05-17 2.3.4 1999-06-01 2.3.5 1999-06-02 2.3.6 1999-06-10 2.0.37 1999-06-14 2.2.10 1999-06-14 2.3.7 1999-06-21 2.3.8 1999-06-22 |
While this is an easy problem to solve using a loop, what is the R-way of solving it (use the xyz package would be the answer half said in jest)? My R-way rule did not allow loops, so a-head scratching I did go. On the assumption that the current branch version dates would be intermingled with releases of previous branches I decided to use simple pair-wise comparison (which could be coded up as a whole vector operation); if an element contained a version number that was less than the element before it, then it was removed.
Here is the code (treat step parameter was introduced later as part of the second phase tidy up; data here):
ld=read.csv("/usr1/rbook/examples/regression/Linux-days.csv") ld$Release_date=as.POSIXct(ld$Release_date, format="%d-%b-%Y") ld.ordered=ld[order(ld$Release_date), ] strip.support.v=function(version.date, step) { # Strip off the least significant value of the Version id v = substr(version.date$Version, 1, 3) # Build a vector of TRUE/FALSE indicating ordering of element pairs q = c(rep(TRUE, step), v[1:(length(v)-step)] <= v[(1+step):length(v)]) # Only return TRUE entries return (version.date[q, ]) } h1=strip.support.v(ld.ordered, 1) |
This pair-wise approach only partially handles the following sequence (2.2.10 is greater than 2.0.37 and so would not be removed).
2.3.6 1999-06-10 2.0.37 1999-06-14 2.2.10 1999-06-14 2.3.7 1999-06-21 |
The no loops rule prevented me iterating over calls to strip.support.v until there were no more changes.
Would a native R speaker assume there would not be many extraneous Version/Release_date pairs and be willing to regard their presence as a minor data pollution problem? If so, I have some way to go before I might be able to behave as a native.
My next line of reasoning was that any contiguous sequence of non-applicable version numbers would probably be a remote island in a sea of applicable values. Instead of comparing an element against its immediate predecessor, it should be compared against an element step back (I chose a value of 5).
h2=strip.support.v(h1, 5) |
The original vector contained 832 rows, which was reduced to 745 and then down to 734 on the second step.
Are there any non-loop solutions that are capable of handling a higher density of non-applicable values? Do tell if you can think of one.
Update (a couple of days later)
Thanks to Charles Lowe, Wojtek and kaz_yos for their solutions using cummax, a function that I was previously unaware of. This was a useful reminder that what other languages do in the syntax/semantics R surprisingly often does via a function call (I’m still getting my head around the fact that a switch-statement is implemented via a function in R); as a wannabe native R speaker I need to remove my overly blinked language approach to problems and learn a lot more about the functions that come as part of the base system
Success does not require understanding
I took part in the second Data Science London Hackathon last weekend (also my second hackathon) and it was a very different experience compared to the first hackathon. Once again Carlos and his team really looked after us.
- The data was released 24 hours before the competition started and even though I had spent less than half an hour looking at it, at the start of the competition I did not feel under any time pressure; those 24 hours allowed me to get used to the data and come up with some useful looking ideas.
- The instructions for the first competition had suggested that people form teams of 3-5 and there was a lot of networking happening before the start time. There was no such suggestion this time and as I networked around looking for people to work with I was surprised by the number of people who wanted to work alone; Jonny and Kannappan were the only members from my previous team (the Outliers) who had entered this event, with Kannappan wanting to work alone and Jonny joining me to create a two person team.
- There was less community spirit this time, possible reasons include a lot more single person teams sitting in the corner doing their own thing, fewer people attending (it is the middle of the holiday season), fewer people staying over until the Sunday (perhaps single person teams got disheartened and left or the extra 24 hours of data access meant that teams ran out of ideas/commitment after 36 hours) or me being reduced to a single person team (Jonny had to leave at 20:00) meant I paid more attention to what was happening on the floor.
The problem was to predict what ratings different people would give to various music artists. We were given data involving 50 artists and 48,645 users (artists and users were anonymous) in five files (one contained the training dataset and another the test dataset).
A quick analysis of the data showed that while there were several thousand rows of data per artist there were only half a dozen rows per person, a very sparse dataset.
The most frequent technique I heard mentioned during my initial conversations with attendees was machine learning. In my line of work I am constantly trying to understand what is going on (the purpose of this understanding is to control and make things better) and consider anybody who uses machine learning as being clueless, dim witted or just plain lazy; the problem with machine learning is that it gives answers without explanations (ok decision trees do provide some insights). This insistence on understanding turned out to be my major mistake, the competition metric is based on correctness of answers and not on how well a competitor understands the problem domain. I had a brief conversation with a senior executive from EMI (who supplied the dataset and provided some of the sponsorship money) who showed up on Sunday morning and he had no problem with machine learning providing answers and not explanations.
Having been overly ambitious last time team Outliers went for extreme simplicity and started out with the linear model glm(Rating ~ AGE + GENDER...) being built for each artist (i.e., 50 models). For a small amount of work we got a score of just over 21 and a place of around 70th on the leader board, now we just needed to include information along the lines of “people who like Artist X also like Artist Y”. Unfortunately the only other member of my team (who did not share my view of machine learning and knew something about it) had a prior appointment and had to leave me consuming lots of cpu time on a wild goose chase that required me to have understanding.
The advantages of being in a team include getting feedback from other members (e.g., why are you wasting your time doing that, look how much better this approach is) and having access to different skill sets (e.g., knowing what magic pixie dust values to use for the optional parameters to machine learning routines). It was Sunday morning before I abandoned the ‘understanding’ approach and started thrashing around using various machine learning techniques, which told me that people demographics (e.g., age and gender) were not particularly good predictors compared to other data but did did not reduce my score to the 13-14 range that could be seen on the leader board’s top 20.
Realizing that seven hours was not enough time to learn how to drive R’s machine learning packages well enough to get me into the top ten, I switched tack and spent a lot more time wandering around chatting to people; those whose score was worse than mine were generally willing to chat. Some had gotten completely bogged down in data cleaning and figuring out how to handle missing data (a subject rarely covered in books but of huge importance in real life), I was surprised to find one team doing most of their coding in SQL (my suggestion to only consider Age+Gender improved their score from 35 to 22), I mocked the people using Clojure (people using a Lisp derived language think they have discovered the one true way and will suffer from self doubt if they are not mocked regularly). Afterwards it struck me that well over 50% of attendees were not British (based on their accents), was this yet another indicator of how far British Universities had dumbed down mathematics teaching that natives did not feel up to the challenge (well done to the Bristol undergraduate who turned up) or were the most gung-ho technical folk in London those who had traveled here to work from abroad?
The London winner was Dell Zhang, the only other person sitting at the table I was on (he sat opposite me throughout the competition), who worked quietly away for the whole 24 hours and seemed permanently unimpressed by the score he was achieving; he described his technique as “brute force random forest using Python (the source will be made available on the Data Science website).
Reading through posts made by competitors after the event was as interesting as last time. Factorization Machines seems to be the hot new technique for making predictions based on very sparse data and the libFM is the software I needed to know about last weekend (no R package providing an interface to this C++ code available yet).
Why does Coverity restrict who can see its tool output?
Coverity generate a lot of publicity from their contract (started under a contract with the US Department of Homeland Security, don’t know if things have changed) to scan large quantities of open source software with their static analysis tools and a while back I decided to have a look at the warning messages they produce. I was surprised to find that access to the output required singing a non-disclosure agreement, this has subsequently been changed to agreeing to a click-through license for the basic features and signing a NDA for access to advanced features. Were Coverity limiting access because they did not want competitors learning about new suspicious constructs to flag, or because they did not want potential customers seeing what a poor job their tool did?
The claim that access “… for most projects is permitted only to members of the scanned project, partially in order to ensure that potential security issues may be resolved before the public sees them.” does not really hold much water. Anybody interested in finding security problems in code could probably find hacked versions of various commercial static analysis tools to download. The SAMATE – Software Assurance Metrics And Tool Evaluation project runs yearly evaluations of static analysis tools and makes the results publicly available.
A recent blog post by Andy Chou, Coverity’s CTO, added weight to the argument that their Scan tool is rather run-of-the-mill. The post discussed a new check that had recently been added flagging occurrences of memcmp, and related standard library functions, that were being tested for equality (or inequality) with specific integer constants (these functions are defined to return a negative or positive value or 0, and while many implementations always return the negative value -1 and the positive value 1 a developer should always test for the property of being negative/positive and not specific values that have that property). Standards define library functions to have a wide variety of different properties, and tools that check for correct application of these properties have been available for over 15 years.
My experience of developer response, when told that some library function is required to return a negative value and some implementation might not return -1, is that they regard any implementation not returning -1 as being ‘faulty’ since all implementations in their experience return -1. I imagine that library implementors are aware of this expectation and try to meet it. However, optimizing compilers often try to automatically inline calls to memcpy and related copy/compare functions and will want to take advantage of the freedom to return any negative/positive value if it means not having to perform a branch test (a big performance killer on most modern processors).
Undefined behavior can travel back in time
The committee that produced the C Standard tried to keep things simple and sometimes made very short general statements that relied on compiler writers interpreting them in a ‘reasonable’ way. One example of this reliance on ‘reasonable’ behavior is the definition of undefined behavior; “… erroneous program construct or of erroneous data, for which this International Standard imposes no requirements”. The wording in the Standard permits a compiler to process the following program:
int main(int argc, char **argv) { // lots of code that prints out useful information 1 / 0; // divide by zero, undefined behavior } |
to produce an executable that prints out “yah boo sucks”. Such behavior would probably be surprising to the developer who expected the code printing the useful information to be executed before the divide by zero was encountered. The phrase quality of implementation is heard a lot in committee discussions of this kind of topic, but this phrase does not appear in any official document.
A modern compiler is essentially a sophisticated domain specific data miner that happens to produce machine code as output and compiler writers are constantly looking for ways to use the information extracted to minimise the code they generate (minimal number of instructions or minimal amount of runtime). The following code is from the Linux kernel and its authors were surprised to find that the “division by zero” messages did not appear when arg2 was 0, in fact the entire if-statement did not appear in the generated code; based on my earlier example you can probably guess what the compiler has done:
if (arg2 == 0) ereport(ERROR, (errcode(ERRCODE_DIVISION_BY_ZERO), errmsg("division by zero"))); /* No overflow is possible */ PG_RETURN_INT32((int32)arg1 / arg2); |
Yes, it figured out that when arg2 == 0 the divide in the call to PG_RETURN_INT32 results in undefined behavior and took the decision that the actual undefined behavior in this instance would not include making the call to ereport which in turn made the if-statement redundant (smaller+faster code, way to go!)
There is/was a bug in Linux because of this compiler behavior. The finger of blame could be pointed at:
- the developers for not specifying that the function
ereportdoes not return (this would enable the compiler to deduce that there is no undefined behavior because the divide is never execute whenarg2 == 0), - the C Standard committee for not specifying a timeline for undefined behavior, e.g., program behavior does not become undefined until the statement containing the offending construct is encountered during program execution,
- the compiler writers for not being ‘reasonable’.
In the coming years more and more developers are likely to encounter this kind of unexpected behavior in their programs as compilers do more and more data mining and are pushed to improve performance. Other examples of this kind of behavior are given in the paper Undefined Behavior: Who Moved My Code?
What might be done to reduce the economic cost of the fallout from this developer ignorance/standard wording/compiler behavior interaction? Possibilities include:
- developer education: few developers are aware that a statement containing undefined behavior can have an impact on the execution of code that occurs before that statement is executed,
- change the wording in the Standard: for many cases there is no reason why the undefined behavior be allowed to reach back in time to before when the statement executing it is executed; this does not mean that any program output is guaranteed to occur, e.g., the host OS might delete any pending output when a divide by zero exception occurs.
- paying gcc/llvm developers to do front end stuff: nearly all gcc funding is to do code generation work (I don’t know anything about llvm funding) and if the US Department of Homeland security are interested in software security they should fund related front end work in gcc and llvm (e.g., providing developers with information about suspicious usage in the code being compiled; the existing
-Wallis a start).
Ternary radix will have to wait for photonic computers
Computer cpu economics suggest that a ternary radix representation rather than binary should be used for representing integer values. The economic cost of a cpu is is roughly proportional to  , where
  is the integer radix and
  is the width, in bits, of the basic integer type (for simplicity I’m assuming there is only one and that the bus width has the same value); the maximum value that can be represented is
  .
.
If we fix the maximum representable value  and ask which value of minimises , then we need to differentiate
  w.r.t. , giving
 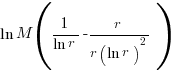 and this equals 0 when
  (the closest integer to
  is 3).
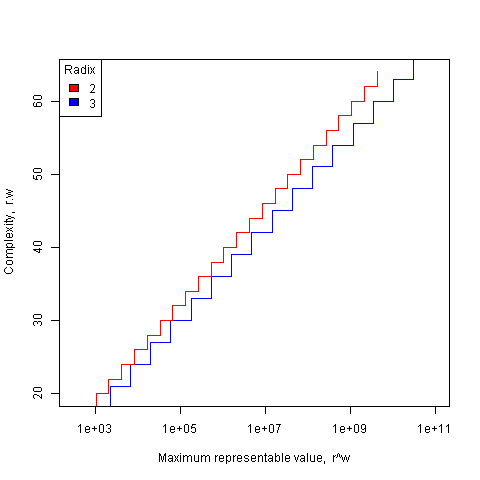
The following plot shows the maximum representable value (right point of horizontal line) that can be achieved for a given ‘cost’ when the radix is 2 and 3.
The reason binary is used in practice is purely to do with the characteristics of power consumption in electronic switching circuits (originally vacuum tube and then transistor based). Electrical power is proportional to voltage times current and a binary circuit can be implemented by switching between states where either the voltage or the current is very small, in either of these two states the power consumption is very low; it is only during the very short transition period switching between them, when the voltage and current have intermediate values, that the power consumed is relatively high. A 3-state switch would need a voltage/current combination denoting a state other than 0/1, and any such combination would consume non-trivial amounts of power (tri-state devices are used in some situations).
I have little idea about the complications of storing ternary values in memory systems, but I guess there will be complications.
In the 1960’s the Setun computer used a ternary radix and there has been the odd experimental systems since.
Are there any kinds of switching circuit whose use is not primarily dictated by device power characteristics and hence might be used to support a ternary radix? One possibility is a light based cpu (i.e., using photons rather than electrons), using polarization to specify state has been proposed. What about storage? Using Josephson junctions could provide the high speed and low power consumption required (we just need somebody to discover a room temperature superconductor).
The technology needed to build a practical cpu using a ternary radix appears to be some years in the future.
What about all the existing code containing a myriad of dependencies on the characteristics of two’s complement integer representation? If a photonic cpu became available that was ten times faster than existing cpus, or consumed 10 times less power or some combination thereof, then I’m sure here would be plenty of economic incentive to get software running on it. The problem is that 10 times better cpus are unlikely to just turn up, they will probably need to be developed in steps and the economics of progressing from step to step don’t look good.
While our civilization is likely to continue on down the binary rabbit hole, another one may have started down, or switched to, the ternary hole. I hope the SETI people are not to blinkered by the binary view of the universe.
Impact of hardware characteristics on detectable fault behavior
Preface. This is the first of what I hope will be many posts analysing experimental data, that will eventually end up in my empirical software engineering with R book (this experiment was chosen because it happens to be the one I am currently working on; having just switched to using Asciidoc I have a backlog of editing to do on previously written analysis, also I have to figure out a way to fix [bracketed words]).
Don’t worry if you don’t know anything about the statistics used. I am aiming to provide information to meet the needs of two audiences (whether or not I fail on both counts remains to be seen):
- Those who want to some idea of what facts are known about a particular software engineering topic. Hopefully reading the introduction+conclusion will enable these readers to form an opinion about the current state of knowledge (taking my statistical analysis on trust).
- Those who are looking for ideas that can be used to analyse a problem they are trying to solve. Hopefully, somewhere among my many analyses will be something that looks like it could be applied to the reader’s problem and motivates them to go off and learn something about the statistics (if they are not already familiar with it; once written the book will obviously help out here).
Forward. The following analysis produces a negative result, something that happens a lot in experiments in all fields of research. It has been included to illustrate the importance of checking the statistical power of an experiment, i.e., how likely the experiment will detect an effect if one is present; it is very easy to fall into the trap of thinking that because lots of tests were done any effect that exists will be detected.
The authors ran an interesting experiment which as far as I know is the only published empirical analysis of intermittent software faults (please let me know if you are aware of other work) and made some mistakes in their statistical analysis. I have made plenty of mistakes in experiments I have run, some of which have found there way into the published write up. The key attribute of an experimentalist is to learn and move on.
A fault does not always noticeably change the behavior of a program when it is executed, apparently correct program execution can occur in the presence of serious faults.
A study by Syed, Robinson and Williams <book Syed_10> investigated how the number of noticeable failures caused by known faults in Mozilla’s Firefox browser varied with processor speed, system memory, hard disc size and system load. A total of 11 known faults causing intermittent failure were selected and nine different hardware configurations were selected. The conditions required to exhibit each fault were replicated and Firefox was executed 10 times for each of hardware configuration, counting the number of noticeable program failures; the seven faults and nine hardware configurations listed in the table below generated a total of 10*7*9 = 630 different executions (four faults either always or never resulted in an observed failure during the 10 runs).
Data
The following table contains the observed number of failures of Firefox for the given fault number when run on the specified hardware configuration.
| Mhz-Mb-Gb | 124750 | 380417 | 410075 | 396863 | 494116 | 264562 | 332330 |
|---|---|---|---|---|---|---|---|
|
667-128-2.5 |
4 |
10 |
6 |
5 |
2 |
3 |
5 |
|
667-256-10 |
4 |
8 |
8 |
6 |
4 |
3 |
8 |
|
667-1000-2.5 |
4 |
7 |
3 |
4 |
3 |
1 |
8 |
|
1000-128-10 |
3 |
10 |
3 |
6 |
0 |
1 |
1 |
|
1000-256-2.5 |
3 |
9 |
0 |
6 |
0 |
1 |
2 |
|
1000-1000-10 |
2 |
9 |
4 |
5 |
0 |
0 |
1 |
|
2000-128-2.5 |
0 |
10 |
5 |
6 |
0 |
0 |
0 |
|
2000-256-10 |
2 |
8 |
5 |
7 |
0 |
0 |
0 |
|
2000-1000-10 |
1 |
7 |
3 |
5 |
0 |
0 |
0 |
Predictions made in advance
There is no prior theory suggesting how the selected hardware characteristics might influence the outcome from this experiment. The analysis is based on searching for a pattern in the results and so the significance level needs to be adjusted to take account of the number of possible patterns that could exist (e.g., using the [Bonferroni correction]).
If we simplify the failure counts by labelling them as one of Low/Medium/High, then there are two arrangements of the failure counts (i.e., low/medium/high and high/medium/low) that would result in a strong correlation for cpu_speed, two arrangements for memory and two for disc size; a total of 6 combinations that would result in a strong correlation being found.
The [Bonferroni correction] adjusts the significance level by dividing by the number of tests, in this case 0.05/6 = 0.0083.
If the failure counts occurred in a random order what is the probability of a strong correlation between failure count and one of the hardware attributes being found? Based on the Low/Medium/High labelling scheme there are 9!/(3! 3! 3!) = 1680 combinations of these counts over 9 slots, giving a 1 in 1680/6 = 280 chance of purely random behavior producing a strong correlation.
The experiment investigated the characteristics of 11 faults. If there is a 1 in 280 chance of finding a strong correlation when analyzing one fault there is approximately a 1 in 24 chance of finding at least one strong correlation when analysing 11 different faults.
Response variable
The response variable takes the form of a proportion whose value varies between 0 and 1, the number of failures out of 10 executions.
Applicable techniques
The following techniques might be used to analyse this data:
- [Factorial design]. This is a way of organizing experiment configurations that is designed to extract the most information for the total number of program runs made. It would be inefficient not to use the results from some hardware configurations just because they are not needed in the factorial design and no results are available for some configurations required by a factorial design (or a [Plackett-Burman] design).
-
Fitting the data using a linear model. A standard linear model, created using R’s lm function, would not be appropriate because of the following two problems:
- this kind of model is likely to make predictions that fall outside the range 0 to 1, something that cannot happen for proportional data,
- this approach assumes that the variance is constant across measurements and unless the proportions involved are very close to each other this requirement will not be met ([proportional data] from a [binomial distribution] has variance p(1-p)).
However, a generalised linear model would not suffer from these problems. There are several [link functions] that could be used:
- the Poisson distribution, is widely used for modelling faults but requires that the mean and variance have the same value, a property that does not apply to proportional data.
- the Binomial distribution, can handle data having the characteristics present here.
The proportional data is specified in the call to the glm function by having the response variable contain two columns, one containing the number of failures (that is what is being predicted in this case) and the other the number of non-failures. The code looks something like the following (see complete example and data):
y=cbind(fail_count, 10-fail_count) glm(y ~ cpu_speed+memory+disk_size, data=ff_data, family=binomial) |
In this kind of GLM it is assumed that the [residual deviance] is the same as the [residual degrees of freedom]. If the residual deviance is greater than the residual degrees of freedom then [overdispersion] has occurred, which happens for fault 380417. To handle overdispersion the family needs to be changed from binomial to quasibinomial, which in the case of fault 380417 changes the p-value of the fit from 0.0348 to 0.0749.
The analysis of each fault finds that only one of them, 332330, has a significance level within the specified acceptable bounds; this has a negative correlation with CPU speed (i.e., observed failures decrease with clock speed).
With only one faults found to have any significant hardware configuration effects we have to ask about the probability of this experiment finding an effect if one was present.
An analysis of the [statistical power] of an experiment investigating the difference between proportions for two hardware configurations (i.e., the percentage of observed failures) needs to know the value of those proportions, the number of runs (10 in this case) and the desired p-value (0.05); to simplify things the plot below is based on using the value of the lowest proportion and the difference between it and the higher proportion. The left plot shows the power achieved (y-axis) there does exist a given difference in proportions (x-axis), the three lowest proportions of 0.05, 0.25 and 0.5 are shown (the result is symmetric about 0.5 and so the plot for 0.75 and 0.95 would be the same as 0.25 and 0.05 respectively), and where there were 10 and 50 runs involving the same fault case.
It can be seen that unless a change in the hardware configuration causes a large change in the number of visible failures then the chance of a difference being detected in results from 10 runs is well below 0.5 (i.e., less than a 50% chance of detecting a difference at a p-value of 0.05 or better).
The right plot in the figure gives the number of runs that need to be made to have a 80% chance of detecting, between two different hardware configurations, the difference in proportion listed on the x-axis, at a significance of 0.05.
It can be seen that if hardware charactersitics account for only 10% of the difference in failure rate over 100 runs would be needed to detect it.
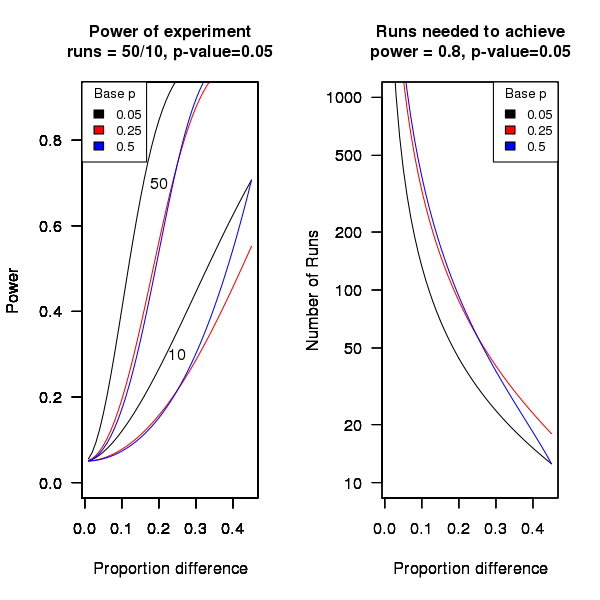
Conclusion
Faults in Firefox that caused intermittent failures were investigated looking for a correlation with system cpu speed, memory or disc size. One fault showed a strong correlation with cpu speed (there is a 1 in 24 chance that one of the investigated faults would have some kind of strong correlation). This experiment may not have found a significant correlation between observed failure rate and hardware configuration because the number of separate runs for each fault (i.e., 10) had [low power].
Recent Comments