Archive
Survey papers: LLMs will restore some level of usefulness
Scientific papers are like soap operas, in that understanding them requires readers to have some degree of familiarity with the ongoing plot.
How can people new to an opera quickly get up to speed with the ongoing story lines, without reading hundreds of papers?
The survey paper is intended to be the answer to this question. Traditionally written by an established researcher in the field, the 100+ pages aim to be an authoritative overview of the progress and setbacks of research on a particular topic within the last 5/10/15 years (depending on the rate/lack of progress since the last major survey paper).
These days research papers are often written by PhD students, with the professor doing the supervising, and getting their name tacked on to the end of the list of authors (professors can spend more time writing grant applications than writing research papers). Writing a single 100+ page survey paper is not a cost-effective use of an experienced person’s time, given the pressure to pump out papers, even when the ACM Computing Surveys is one of the highest ranked journals in computing. The short lifecycle of fields driven by the next fashionable topic is another disincentive.
Given the incentives, why are survey papers still being published?
In software engineering there are now two kinds of survey papers: 1) the traditional kind, written by people who see it as a service, or are not on the publish/perish treadmill, or early stage researchers surveying a niche topic, 2) PhD students using what we now call a Large language model summary approach, soon to be replaced by real LLMs.
So-called survey papers (at least in software engineering) are now regularly being written by members of the intended audience of traditional survey papers, i.e., PhD students who are new to the field and want a map of the territory showing the routes to the frontiers.
How does a person who knows almost nothing about a field write a (20-40 page, rarely 100+) survey paper about it?
A survey is based on the list of all the appropriate papers. In theory, appropriate papers have to meet some quality criteria, e.g., be published in a reputable journal/conference/blog. In practice, the list is created by searching various academic publication search engines (e.g., web of science, or the ACM digital library) using a targeted regular expression; for instance:
(agile OR waterfall OR software OR "story points" OR "story point" OR "user stories" OR "function points" OR "planning poker" OR "pomodoros" OR "use case" OR "source code" OR "DORA metrics" OR scrum) (predict OR prediction OR quantify OR dataset OR schedule OR lifecycle OR "life cycle" OR estimate OR estimates OR estimating OR estimation OR estimated OR #noestimates OR "evidence" OR empirical OR evolution OR ecosystems OR cognitive OR economics OR reliability OR metrics OR experiment) |
The list of papers returned may be filtered further, depending on how many there are (a hundred or two does not look too lightweight, and does not require an excessive amount of work).
Next, what to say about these papers, and how many of them actually need to be read?
The bottom of the barrel, vacant ideas, survey paper tabulates easily calculated metrics (e.g., number of papers per year, number of authors per paper, clusters of keywords), and babble on about paper selection criteria, keyword growth and diversity, and more research is needed.
For a survey paper to appear in a layer above the vacant ideas level, the authors have to process some amount of the paper contents. The paper A Systematic Literature Review on Reasons and Approaches for Accurate Effort Estimations in Agile by Pasuksmit, Thongtanunam, and Karunasekera is a recent example of one such survey. The search criteria returned 519 papers, of which 82 were selected for inclusion, i.e., cited. The first 10, of the 42 pages, covered the selection process and the process used to answer the two research questions; RQ1: What are the discovered reasons for inaccurate estimations in Agile iterative development? and RQ2: What are the approaches proposed to improve effort estimation in Agile iterative development?
The main answers to the research questions appeared in: 1) tables which listed attributes relating to the question and the papers that had something to say about that attribute, and 2) sections containing a few paragraphs highlighting various points made by papers about some attribute.
My primary interest was Table 11, which listed the papers/dataset used. A few were new to me, but unfortunately all confidential.
A survey can only be as good as the papers it is based on. The regular expression approach can miss important papers and include unimportant papers. The Pasuksmit et al paper only included one paper by the leading researcher in Agile effort estimation, and included papers that I wouldn’t waste disk space on a pdf file.
I would not recommend these ‘LLM’ style surveys to newcomers to a field. They don’t connect the lines of research, call out the successes/failures, and they don’t provide a map of the territory.
The readership of these survey papers are the experienced researchers, who will scan the list of cited papers looking for anything they might have missed.
I’m not expecting LLMs to be capable of producing experienced professor level survey papers any time soon. In a year or two, LLMs will surely be doing a better job than PhD students.
Rounding and heaping in non-software estimates
Round numbers are often preferred in software task estimation times, e.g., 1, 5, 7 (hours in one working day), and 14. This human preference for round numbers is not specific to software, or to estimating. Round numbers can act as goals, as clustering points, may be used more often as uncertainty increases, or be the result of satisficing, etc.
Rounding can occur in response to any question involving a numeric value, e.g., a government census or survey asking citizens about their financial situation or health. Rounding introduces error in the analysis of data. The Whipple index, described in 1919, was the first attempt to quantify the amount of error; calculated as: “per cent which the number reported as multiples of 5 forms of one-fifth of the total number between ages 23 to 62 years inclusive.” for errors of reported age. Other metrics for this error have been proposed, and packages to calculate them are available.
At some point (the evidence suggests a 1940 paper) a published paper introduced the term heaping effect. These days, heaping is more often used to name the process, compared to rounding, e.g., heaping of values; ‘heaping’ papers do use the term rounding, but I have not seen ’rounding’ papers use heaping.
The choice of rounding values depends on the unit of measurement. For instance, reported travel arrival/departure times are rounded to intervals of 5, 14, 30 and 60 minutes; based on reported/actual travel times it is possible to estimate the probability that particular rounding intervals have been used.
The Whipple index fails when all the values are large (e.g., multiple thousands), or take a small range of values (e.g., between one and twenty).
One technique for handling rounding of large values is to define roundedness in terms of the fraction of value digits that are trailing zeroes. The plot below shows the number of households having a given estimated balance on their first mortgage in the 2013 Survey of Consumer Finances (in red), and the distribution of actual balances reported by the New York Federal Reserve (in blue/green; data extracted from plot in a paper and scaled to equalize total mortgage values; code+data):
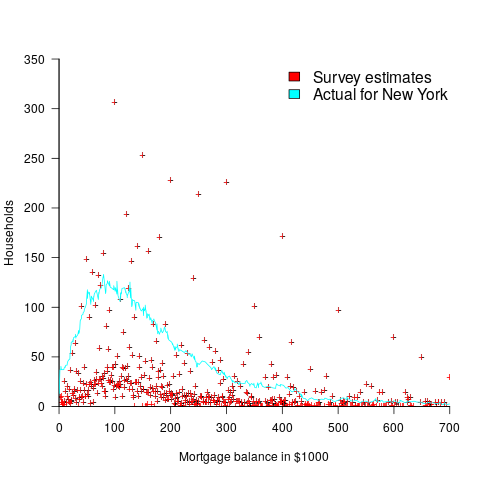
The relatively high number of distinct round numbers swamps any underlying distribution of actual values. While some values having some degree of roundness occur more often than non-round values, they still appear less often than expected by the known distribution. It is possible that homeowners have mortgages at round values because they of banking limits, or reasons other than rounding when answering the survey.
The plot below shows the number of people reporting having a given number of friends, plus number of cigarettes smoked per day, from the 2015 survey of Objective and Subjective Quality of Life in Poland (code+data):
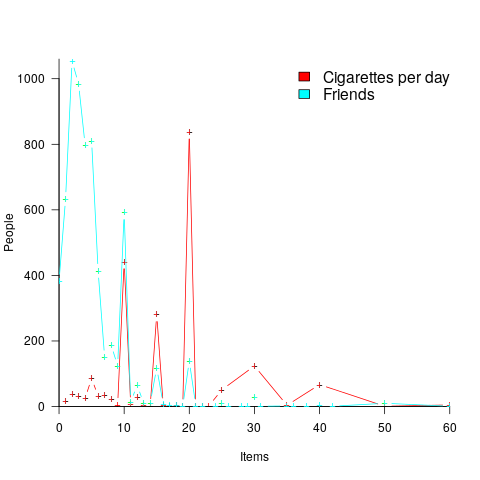
The narrow range of a person’s number of friends prevents the Whipple index from effectively detecting rounding/heaping.
The dominance of round numbers in the cigarettes smoked per day may be caused by the number of cigarettes contained in a packet, i.e., people may be accurately reporting that they smoke the contents of a packet, rather than estimating a rounded number.
Simple techniques are available for correcting the mean/variance when values are always rounded to specified boundaries. When the probability of rounding is not 100%, the calculation is more complicated.
Rounded/Heaped data contains multiple distributions, i.e., the non-rounded values and the rounded values; various mixture models have been proposed to fit such data. Alternatively, the data can be ‘deheaped’, and various deheaping techniques have been proposed.
Given the prevalence of significant amounts of rounding/heaping, it’s surprising how few people know about it.
Surveys are fake research
For some time now, my default position has been that software engineering surveys, of the questionnaire kind, are fake research (surveys of a particular research field used to be worth reading, but not so often these days; that issues is for another post). Every now and again a non-fake survey paper pops up, but I don’t consider the cost of scanning all the fake stuff to be worth the benefit of finding the rare non-fake survey.
In theory, surveys could be interesting and worth reading about. Some of the things that often go wrong in practice include:
- poorly thought out questions. Questions need to be specific and applicable to the target audience. General questions are good for starting a conversation, but analysis of the answers is a nightmare. Perhaps the questions are non-specific because the researcher is looking for direction: well please don’t inflict your search for direction on the rest of us (a pointless plea in the fling it at the wall to see if it sticks world of academic publishing).
Questions that demonstrate how little the researcher knows about the topic serve no purpose. The purpose of a survey is to provide information of interest to those in the field, not as a means of educating a researcher about what they should already know,
- little effort is invested in contacting a representative sample. Questionnaires tend to be sent to the people that the researcher has easy access to, i.e., a convenience sample. The quality of answers depends on the quality and quantity of those who replied. People who run surveys for a living put a lot of effort into targeting as many of the right people as possible,
- sloppy and unimaginative analysis of the replies. I am so fed up with seeing an extensive analysis of the demographics of those who replied. Tables containing response break-down by age, sex, type of degree (who outside of academia cares about this) create a scientific veneer hiding the lack of any meaningful analysis of the issues that motivated the survey.
Although I have taken part in surveys in the past, these days I recommend that people ignore requests to take part in surveys. Your replies only encourage more fake research.
The aim of this post is to warn readers about the growing use of this form of fake research. I don’t expect anything I say to have any impact on the number of survey papers published.
Survey of instruction selection
A well written survey of compiler instruction selection has just become available, the first major survey of this topic in 30 years! The academic outlook of the author is given away by the evaluation “…the technique appears to have had very limited impact as the citation count for the paper is low.” and coverage for the last 10 years does tend to thin out (but that could fill another 100 pages). Whatever your interest in compilers this survey is well worth a read.
Anybody reading a compiler book could be forgiven for thinking that instruction set selection was a minor issue; Gabriel Hjort Blindell counted 160 pages devoted to the topic out of 4,600 pages in seven well known compiler books. In a production compiler it is the parsing and semantics that consume 3% of the code with optimization and code generation making up the other 97%.
A 100 page survey of register allocation is also overdue (20 pages is a bit short).
Instruction set selection is one quarter of code generation, another quarter being register allocation and the remaining half being how these two are woven together (Hjort Blindell lists instruction scheduling as a third component and we could all argue for hours about whether this is another optimization, something that is spread over instruction selection/register allocation or a distinct component).
For a given choice of registers there are algorithms that will select the optimal code and for a given sequence of code there are algorithms that will select the optimal registers to use. Papers covering the optimal selection of both registers and instructions are thin on the ground; this is something of a black art that is picked up by building a production compiler.
Why is Cobol still popular in Japan?
Rummaging around the web for empirical software engineering data, I found a survey of programming language usage in Japan. This survey (based on 505 projects in 24 companies) has Cobol in the number two slot for 2012, a bit higher than I would have expected (it very rarely appears at all in US/UK ‘popularity’ lists):
Language       Projects
Java             822  28.2%
COBOL            464  15.9%
VB               371  12.7%
C                326  11.2%
Other languages  208   7.1%
C++              189   6.5%
Visual Basic.NET 136   4.7%
Visual C++       105   3.6%
C#               101   3.5%
PL/SQL            57   2.0%
Pro*C             23   0.8%
Excel(VBA)        18   0.6%
Developer2000     17   0.6%
ABAP              15   0.5%
HTML              14   0.5%
Delphi            11   0.4%
PL/I              10   0.3%
Perl              10   0.3%
PowerBuilder       7   0.2%
Shell              7   0.2%
XML                6   0.2%
A quick overview of Cobol for those readers who have never encountered it.
Cobol is a domain specific language ideally suited for business data processing in the 1960/70/80/90s. During this period computer memory was often measured in kilobytes, data came in an unbelievably wide range of different formats, operations on data mostly involved sorting and basic arithmetic, and output data format was/is very important. By “unbelievably wide range” think of lots of point-of-sale vendors deciding how their devices would write data to punch cards/paper tape/magnetic tape, just handling the different encodings that have been used for the plus/minus sign can make the head spin; combine the requirement that programs handle different data formats with tiny computer memory capacity, and you get data structure overlays that make C programmers look like rank amateurs, all the real action in Cobol programs occurs in the DATA DIVISION.
So where are we today? Companies use computers to solve a wider range of problems don’t they (so even if Cobol usage stayed the same its percentage usage should be low)? If point-of-sale terminals still produce a wide range of weird and wonderful data formats, isn’t it easy enough to write the appropriate libraries to convert (and we have much more storage these days)?
Why might Cobol still be so popular in Japan (and perhaps elsewhere, if anybody over 25 was included in the survey)? Some ideas:
- Cobol is still the best language to use for business data processing,
- the sample is not representative of the Japanese software development industry. As a government body perhaps the Information-Technology Promotion Agency primarily deals with large well established companies; the data came from a relatively small number of companies (i.e., 24),
- the Japanese are known for being conservative and maintaining traditions. Change is almost considered a necessity here in the West, this has led to the use of way too many programming languages in industry (I have previously written about what a mistake it is to invent a new language).
Birth month for compiler writers
Today is my birthday and an event from a long ago project springs to mind. All four of us from the UK arm of the team were born in February, one person on the same day as me (Happy Birthday Mick, where ever you are). This clustering of birth months led us to the obvious conclusion that the best compiler writers are born in February. Over the years I have retold this story to other compiler writers and found out their birth month. Now I will try and be a bit more scientific and have set up a survey (see below).
What counts as a compiler and what does somebody have to do to be considered a compiler writer (lets stay away from the issue of quality)? I would include software that performs computer language translation to another language (i.e., not just intermediate code or assembler) and static analysis of source provided it involved a lot of semantics (i.e., not working on the GUI that presents the data). I would exclude writing test cases, documentation, project management and maintenance (i.e., only fixing faults and dealing with customer queries).
I would classify a compiler writer as somebody who spent a substantial amount of their time working almost exclusively on writing a compiler. How substantial? Well, I think it ought o be possible to do something useful in about 4 months (I thought about saying 6 months, but decided to be generous.
Please take part, even if you do not consider yourself to be a compiler writer. A control group is always useful (perhaps readers of this blog have a preferred birth month)
I will make the numbers available and discuss them in a future article (probably in March).
[SURVEYS 1]
If anybody else is interested in running a survey, the surveys WordPress plugin allows more than one question to be specified and worked better than the other popular plugins for me (there is one bug that needs to be fixed: show_survey.php, line 51 should be:
$email_body = t("Hi,\nThere is a new result for the survey at %s...\n", $_SERVER['REQUEST_URI']); ).
Recent Comments