Archive
Computers installed in the UK during the 1960s
The first commercially produced digital computer, the UNIVAC I, became available in 1951, and by 1961 the exponential annual growth in the number of computers installed was well underway (it may have been earlier, but earlier data is sparse).
For the UK, detailed annual installation data is listed in the paper: The Spread of Computer Usage in the UK, 1954-1970 by P. Stoneman (his PhD thesis: “Technological Diffusion and the Computer Revolution: The UK experience” is not available online {I have the book of the thesis}; perhaps someone from Cambridge could scan a copy of the thesis). The data comes from the trade periodical “Computer Survey”, and Stoneman extrapolated back from when it started in 1961. The plot below shows the number of computers installed in the UK in a given year, and the number still installed in subsequent years (colored line for each year), along with two fitted regression lines (both exponential; code+data):
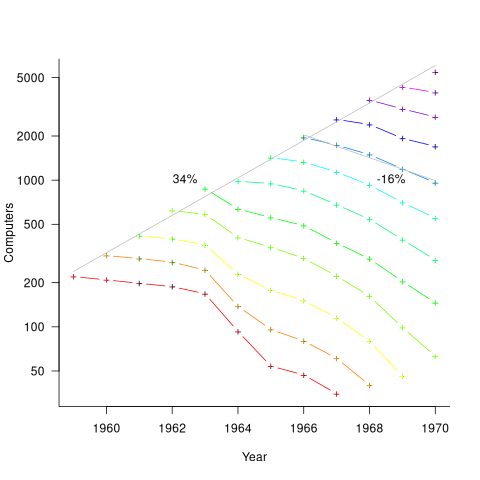
Between 1958 and 1970 (end of the data) the annual growth rate of new computers was 34%. After the first year, installations decline at a rate of around 16% per year (presumably replaced by a more powerful system).
Which industries installed these computers? The plot below shows the annual spend (adjusted for inflation til 2026) on new computer systems by 26 UK industry classifications, the grey line is an exponential fit to the total, showing a 53% annual growth rate (code+data):
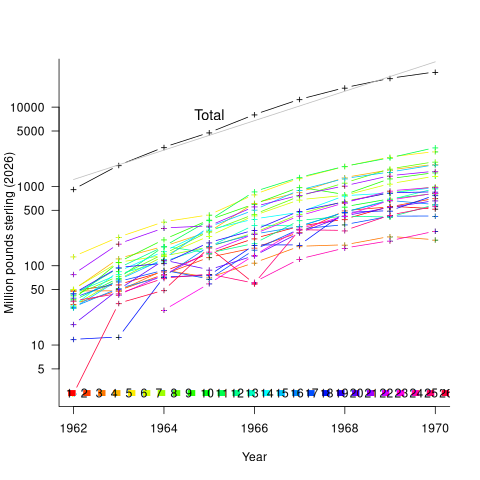
The mapping from colored line to industry is via the numbers/colors in the legend at the bottom of the plot, and the table below:
 Number           Industry description
    1      Aircraft Manufacturers and Guided Weapons
    2      Armed Services
    3      Atomic Energy
    4      Chemicals, Rubber, Glass, Plastics, Paints, Cosmetics
    5      Computer Manufacturers and Service Bureaux
    6      Electrical Engineering
    7      Ferrous and Non-Ferrous Metals, Mining and Quarrying
    8      Financial: Banks, Building Societies etc.
    9      Food, Drink and Tobacco Manufacturers
   10      Retail, Wholesale, Mail Order, Merchants
   11      General and Constructional Engineering
   12      Government Departments
   13      Government and Other Research Establishments
   14      Insurance and Assurance
   15      Local Government
   16      Motor
   17      Oil
   18      Public Bodies (mainly Post Office)
   19      Public Utilities (Coal, Electricity, Gas, Water)
   20      Transport
   21      Universities and Other Educational Establishments
   22      Textiles, Clothing, Furniture and Toys
   23      Publishing, Printing, Paper, Book clubs
   24      Sports, Leisure, TV, Films, Hotels
   25      Miscellaneous
26 Unknown |
The higher spending industries tended to be those with lower Numbers, while the lower spending industries are at the higher Numbers. The total spend on new computers grew at 53% per year.
How much computer power did the £27.8 billion (in 2026 money) spent in 1970 buy?
In the 1960s most computers were used by businesses for regularly (i.e., weekly, monthly, quarterly) performing simple calculations on large quantities of information, and then printing the results. The printed outputs were items such as employee payslips, gas/electric/water bills, and invoices between companies.
The scientific/engineering uses of computers attracted most of the coverage in the popular press (after a few iterations, weekly/monthly payroll becomes deadly dull), and bought the larger machines, but businesses had a lot more money and an immediate need.
The British Commercial Computer Digest (published annually between 1959 and 1970, and also based on “Computer Survey” magazine data) lists computer installations by purchaser and computer installed, along with tables of computer performance, monthly lease prices and selling prices. The following data was obtained from the 10th edition, published in 1969.
The plot below shows the number of organizations having a given number of computers installed, along with a fitted power law whose exponent is -2.8 (code+data):

The table below shows the six computer models, out of 48, that represented 60% of all computers installed. The monthly rentals are an estimated average, and inflation adjusted 2026 pounds sterling. Possible memory capacities varied between 4k to 64k (yes, thousands of bytes). Readers will be familiar with the IBM 360, the ICL 1900 series was the UK’s home-grown response (via Canada):
        Computer    Installed    Percent   Monthly rental
       IBM 360/30     305          17          £42k
       ICL 1901       253          14          £21k
       IBM 360/20     147           8          £17k
       ICL 1902       138           8          £37k
       IBM 360/40     127           7          £84k
ICL 1903 101 6 £45k |
The compute capacity of UK computers installed in 1969 might be less than one 2026 smartphone. However, the computer printer capacity (in bills/payroll slips/invoices/etc) might be about the same as it is today, down from a peak in the late 1990s, when the major push to electronic billing started.
Software companies in the UK
How many software companies are there in the UK, and where are they concentrated?
This question begs the question of what kinds of organization should be counted as a software company. My answer to this question is driven by the available data. Companies House is the executive agency of the British Government that maintains the register of UK companies, and basic information on 5,562,234 live companies is freely available.
The Companies House data does not include all software companies. A very small company (e.g., one or two people) might decide to save on costs and paperwork by forming a partnership (companies registered at Companies House are required to file audited accounts, once a year).
When registering, companies have to specify the business domain in which they operate by selecting the appropriate Standard Industrial Classification (SIC) code, e.g., Section J: INFORMATION AND COMMUNICATION, Division 62: Computer programming, consultancy and related activities, Class 62.01: Computer programming activities, Sub-class 62.01/2: Business and domestic software development. A company’s SIC code can change over time, as the business evolves.
Searching the description associated with each SIC code, I selected the following list of SIC codes for companies likely to be considered a ‘software company’:
   62011 Ready-made interactive leisure and entertainment
                                                 software development
   62012 Business and domestic software development
   62020 Information technology consultancy activities
   62030 Computer facilities management activities
   62090 Other information technology service activities
   63110 Data processing, hosting and related activities
63120 Web portals |
There are 287,165 companies having one of these seven SIC codes (out of the 1,161 SIC codes currently used); 5.2% of all currently live companies. The breakdown is:
All 62011 62012 62020 62030 62090 63110 63120 5,562,234 7,217 68,834 134,461 3,457 57,132 7,839 8,225 100% 0.15% 1.2% 2.4% 0.06% 1.0% 0.14% 0.15% |
Only one kind of software company (SIC 62020) appears in the top ten of company SIC codes appearing in the data:
Rank SIC Companies 1 68209 232,089 Other letting and operating of own or leased real estate 2 82990 213,054 Other business support service activities n.e.c. 3 70229 211,452 Management consultancy activities other than financial management 4 68100 194,840 Buying and selling of own real estate 5 47910 165,227 Retail sale via mail order houses or via Internet 6 96090 134,992 Other service activities n.e.c. 7 62020 134,461 Information technology consultancy activities 8 99999 130,176 Dormant Company 9 98000 118,433 Residents property management 10 41100 117,264 Development of building projects |
Is the main business of a company reflected in its registered SIC code?
Perhaps a company started out mostly selling hardware with a little software, registered the appropriate non-software SIC code, but over time there was a shift to most of the income being derived from software (or the process ran in reverse). How likely is it that the SIC code will change to reflect the change of dominant income stream? I have no idea.
A feature of working as an individual contractor in the UK is that there were/are tax benefits to setting up a company, say A Ltd, and be employed by this company which invoices the company, say B Ltd, where the work is actually performed (rather than have the individual invoice B Ltd directly). IR35 is the tax legislation dealing with so-called ‘disguised’ employees (individuals who work like payroll staff, but operate and provide services via their own limited company). The effect of this practice is that what appears to be a software company in the Companies House data is actually a person attempting to be tax efficient. Unfortunately, the bulk downloadable data does not include information that might be used to filter out these cases (e.g., number of employees).
Are software companies concentrated in particular locations?
The data includes a registered address for each company. This address may be the primary business location, or its headquarters, or the location of accountants/lawyers working for the business, or a P.O. Box address. The latitude/longitude of the center of each address postcode is available. The first half of the current postcode, known as the outcode, divides the country into 2,951 areas; these outcode areas are the bins I used to count companies.
Are there areas where the probability of a company being a software company is much higher than the national average (5.265%)? The plot below shows a heat map of outcode areas having a higher than average percentage of software companies (36 out of 2,277 outcodes were at least a factor of two greater than the national average; BH7 is top with 5.9 times more companies, then RG6 with 3.7 times, BH21 with 3.6); outcodes having fewer than 10 software companies were excluded (red is highest, green lowest; code+data):
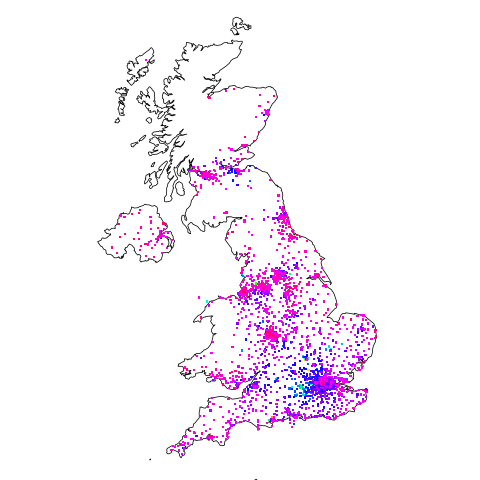
The higher concentrations are centered around the country’s traditional industrial towns and cities, with a cluster sprawling out from London. Cambridge is often cited as a high-tech region, but its highest outcode, CB4, is ranked 39th, at twice the national average (presumably the local high-tech is primarily non-software oriented).
Which outcode areas contain the most software companies? The following list shows the top ten outcodes, by number of registered companies (only BN3 and CF14 are outside London):
   Rank Outcode  Software companies
    1     WC2H      10,860
    2     EC1V       7,449
    3     N1         6,244
    4     EC2A       3,705
    5     W1W        3,205
    6     BN3        2,410
    7     CF14       2,326
    8     WC1N       2,223
    9     E14        2,192
10 SW19 1,516 |
I’m surprised to see west-central London with so many software companies. Perhaps these companies are registered at their accountants/lawyers, or they are highly paid contractors who earn enough to afford accommodation in WC2. East-central London is the location of nearly all the computer companies I know in London.
Recent Comments