Archive
Computers installed in the UK during the 1960s
The first commercially produced digital computer, the UNIVAC I, became available in 1951, and by 1961 the exponential annual growth in the number of computers installed was well underway (it may have been earlier, but earlier data is sparse).
For the UK, detailed annual installation data is listed in the paper: The Spread of Computer Usage in the UK, 1954-1970 by P. Stoneman (his PhD thesis: “Technological Diffusion and the Computer Revolution: The UK experience” is not available online {I have the book of the thesis}; perhaps someone from Cambridge could scan a copy of the thesis). The data comes from the trade periodical “Computer Survey”, and Stoneman extrapolated back from when it started in 1961. The plot below shows the number of computers installed in the UK in a given year, and the number still installed in subsequent years (colored line for each year), along with two fitted regression lines (both exponential; code+data):
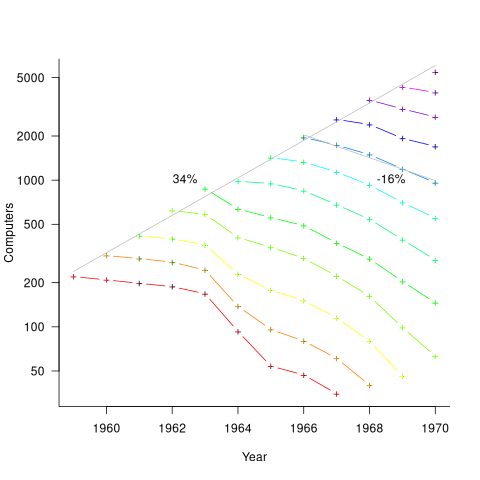
Between 1958 and 1970 (end of the data) the annual growth rate of new computers was 34%. After the first year, installations decline at a rate of around 16% per year (presumably replaced by a more powerful system).
Which industries installed these computers? The plot below shows the annual spend (adjusted for inflation til 2026) on new computer systems by 26 UK industry classifications, the grey line is an exponential fit to the total, showing a 53% annual growth rate (code+data):
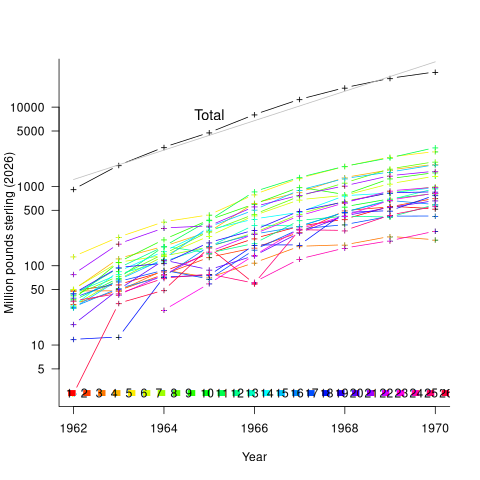
The mapping from colored line to industry is via the numbers/colors in the legend at the bottom of the plot, and the table below:
 Number           Industry description
    1      Aircraft Manufacturers and Guided Weapons
    2      Armed Services
    3      Atomic Energy
    4      Chemicals, Rubber, Glass, Plastics, Paints, Cosmetics
    5      Computer Manufacturers and Service Bureaux
    6      Electrical Engineering
    7      Ferrous and Non-Ferrous Metals, Mining and Quarrying
    8      Financial: Banks, Building Societies etc.
    9      Food, Drink and Tobacco Manufacturers
   10      Retail, Wholesale, Mail Order, Merchants
   11      General and Constructional Engineering
   12      Government Departments
   13      Government and Other Research Establishments
   14      Insurance and Assurance
   15      Local Government
   16      Motor
   17      Oil
   18      Public Bodies (mainly Post Office)
   19      Public Utilities (Coal, Electricity, Gas, Water)
   20      Transport
   21      Universities and Other Educational Establishments
   22      Textiles, Clothing, Furniture and Toys
   23      Publishing, Printing, Paper, Book clubs
   24      Sports, Leisure, TV, Films, Hotels
   25      Miscellaneous
26 Unknown |
The higher spending industries tended to be those with lower Numbers, while the lower spending industries are at the higher Numbers. The total spend on new computers grew at 53% per year.
How much computer power did the £27.8 billion (in 2026 money) spent in 1970 buy?
In the 1960s most computers were used by businesses for regularly (i.e., weekly, monthly, quarterly) performing simple calculations on large quantities of information, and then printing the results. The printed outputs were items such as employee payslips, gas/electric/water bills, and invoices between companies.
The scientific/engineering uses of computers attracted most of the coverage in the popular press (after a few iterations, weekly/monthly payroll becomes deadly dull), and bought the larger machines, but businesses had a lot more money and an immediate need.
The British Commercial Computer Digest (published annually between 1959 and 1970, and also based on “Computer Survey” magazine data) lists computer installations by purchaser and computer installed, along with tables of computer performance, monthly lease prices and selling prices. The following data was obtained from the 10th edition, published in 1969.
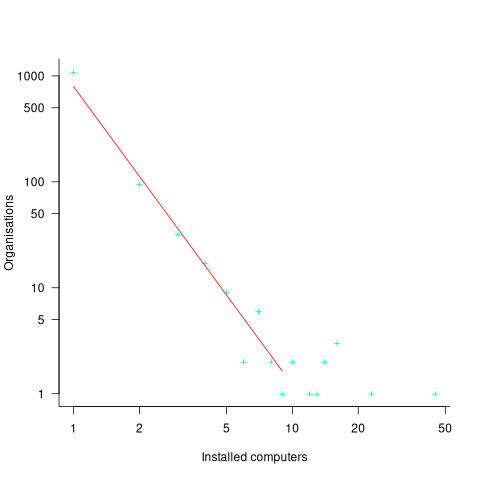
The plot below shows the number of organizations having a given number of computers installed, along with a fitted power law whose exponent is -2.8 (code+data):
The table below shows the six computer models, out of 48, that represented 60% of all computers installed. The monthly rentals are an estimated average, and inflation adjusted 2026 pounds sterling. Possible memory capacities varied between 4k to 64k (yes, thousands of bytes). Readers will be familiar with the IBM 360, the ICL 1900 series was the UK’s home-grown response (via Canada):
        Computer    Installed    Percent   Monthly rental
       IBM 360/30     305          17          £42k
       ICL 1901       253          14          £21k
       IBM 360/20     147           8          £17k
       ICL 1902       138           8          £37k
       IBM 360/40     127           7          £84k
ICL 1903 101 6 £45k |
The compute capacity of UK computers installed in 1969 might be less than one 2026 smartphone. However, the computer printer capacity (in bills/payroll slips/invoices/etc) might be about the same as it is today, down from a peak in the late 1990s, when the major push to electronic billing started.
Recent Comments