Archive
Detailed management data on 1,211 software projects
Until April this year there were only two non-trivial publicly available software project datasets (i.e., Sip and CESAW) containing software project data relating to human effort, e.g., people time, elapsed time, and tasks performed. The SiP data contains 10-years of software development tasks by one company, and the CESAW data contains the tasks involved in implementing 45 software projects.
Two months ago the Software Excellence Alliance released the SEA Data Warehouse (the CESAW data is roughly a 10% subset of SEA). This post compares software project size from the perspective of various management related features.
An analysis of pre-LLM project development is still relevant because many project behavior patterns are driven by interactions with the outside world. Also, time spent writing code is often small part of project development.
The headline summary is that there is development-phase/estimates/actuals/start-time/end-time/person/team/etc information for the 679,904 tasks involved in implementing 1,211 software projects.
The projects were developed using the Team Software Process (TSP). This is an iterative development process that uses development phases similar to the Waterfall process, with weekly meeting that monitor progress using earned-value management. Given that the work-breakdown structure (WBS) is used to break down a project into a hierarchy of smaller and smaller components, these projects are US Department of Defense related.
The plot below shows, for each of the 1,211 projects (sorted by number of plans, in black), the number of tasks (blue), WBS (green), and deleted plans (red) ( ; code+data):
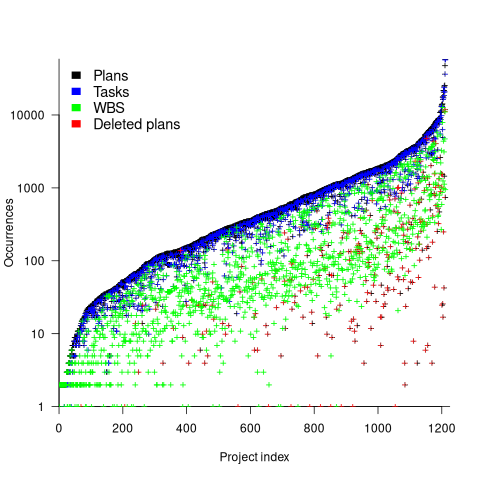
The average ratio of  is 8.4 (standard deviation 23). An exponential or power law (not Weibull) can be fitted to portions of the distribution of project sizes, measured in number of plans or tasks. If project size really does follow a single common distribution, a much larger sample size will be needed to reliably fit it.
The plot below shows, for each project (sorted by total person hours, in red), the number of elapsed days from start of first to end of last task (green), and number of people who worked on at least one task (blue) (projects implemented by a single person do not have consistent time data; code+data):
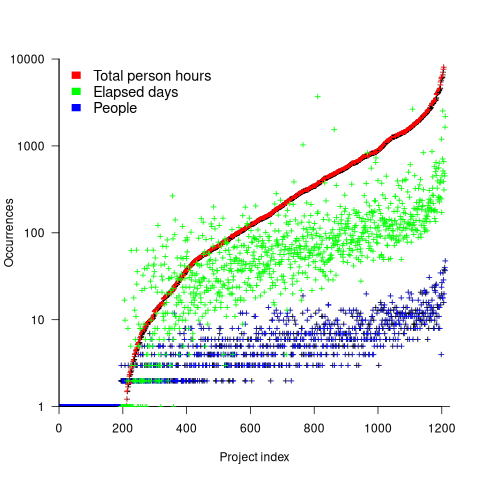
For a given number of person hours worked on a project, there is an order of magnitude variation in elapsed days and number of people who worked on at least one task.
This dataset contains a huge amount of detail, and I’m sure there are lots of patterns to be found. But, what are the important questions to ask, that would be useful to project managers. When I ask managers what project questions they would like answers, the response is often one of quizzical uncertainty. There are plenty of people promoting their opinions, and it’s very rare to encounter anybody asking meaningful questions.
Recent Comments