Archive
Programming using genetic algorithms: isn’t that what humans already do ;-)
Some time ago I wrote about the use of genetic programming to fix faults in software (i.e., insertion/deletion of random code fragments into an existing program). Earlier this week I was at a lively workshop, Genetic Programming for Software Engineering, with some of the very active researchers in this new subfield.
The genetic algorithm works by having a population of different programs, selecting X% of the best (as measured by some fitness function), making random mutations to those chosen and/or combining bits of programs with other programs; these modified programs are fed back to the fitness function and the whole process iterates until an acceptable solution is found (or a maximum iteration limit is reached).
There are lots of options to tweak; the fitness function gets to decide who has children and is obviously very important, but it can only work with what get generated by the genetic mutations.
The idea I was promoting, to anybody unfortunate enough to be standing in front of me, was that the pattern of usage seen in human written code provides lots of very useful information for improving the performance of genetic algorithms in finding programs having the desired characteristics.
I think that the pattern of usage seen in human written code is driven by the requirements of the problems being solved and regular occurrence of the same patterns is an indication of the regularity with which the same requirements need to be met. As a representation of commonly occurring requirements these patterns are pre-tuned templates for genetic mutation and information to help fitness functions make life/death decisions (i.e., doesn’t look human enough, die!)
There is some noise in existing patterns of code usage, generated by random developer habits and larger fluctuations caused by many developers following the style in some popular book. I don’t have a good handle on estimating the signal to noise ratio.
There has been some work comparing the human maintainability of patches that have been written by genetic algorithms/humans. One of the driving forces behind this work is the expectation that the final patch will still be controlled by humans; having a patch look human-written like is thought to increase the likelihood of it being ‘accepted’ by developers.
Genetic algorithms are also used to improve the runtime performance of programs. Bill Langdon reported that the authors of a program ‘he’ had speeded up by a factor of 70 had not responded to his emails. This may be a case of the authors not knowing how to handle something somewhat off the beaten track; it took a while for Linux developers to start responding to batches of fault reports generated as part of software analysis projects by academic research groups.
One area where human-like might not always be desirable is test case generation. It is easy to find faults in compilers by generating random source code (the syntax/semantics of the randomness follows the rules of the language standard). This approach results in an unmanageable number of fault. Is it worth fixing a fault generated by code that looks like it would never be written by a person? Perhaps the generator should stick to producing test cases that at least look like the code might be written by a person.
Single-quote as a digit separator soon to be in C++
At the C++ Standard’s meeting in Chicago last week agreement was finally reached on what somebody in the language standards world referred to as one of the longest bike-shed controversies; the C++14 draft that goes out for voting real-soon-now will include support for single-quotation-mark as a digit separator. Assuming the draft makes it through ISO voting you could soon be writing (Compiler support assumed) 32'767 and 0.000'001 and even 1'2'3'4'5'6'7'8'9 if you so fancied, in your conforming C++ programs.
Why use single-quote? Wouldn’t underscore have been better? This issue has been on the go since 2007 and if you feel really strongly about it the next bike-shed C++ Standard’s meeting is in Issaquah, WA at the start of next year.
Changing the lexical grammar of a language is fraught with danger; will there be a change in the behavior of existing code? If the answer is Yes, then the next question is how many people will be affected and how badly? Let’s investigate; here are the lexical details of the proposed change:
pp-number: digit . digit pp-number digit pp-number ' digit pp-number ' nondigit pp-number identifier-nondigit pp-number e sign pp-number E sign pp-number . |
Ideally the change of behavior should cause the compiler to generate a diagnostic, when code containing it is encountered, so the developer gets to see the problem and do something about it. The following conforming C++ code will upset a C++14 compiler (when I write C++ I mean the C++ Standard as it exists in 2013, i.e., what was called C++11 before it was ratified):
#define M(x) #x // stringize the macro argument char *p=M(1'2,3'4); |
At the moment the call to the macro M contains one argument, the sequence of three tokens {1}, {'2,3'} and {4} (the usual convention is to bracket the characters making up one token with matching curly braces).
In C++14 the call to M will contain the two arguments {1'2} and {3,4}. conforming compiler is required to complain when the number of arguments to a macro invocation don’t match the definition…. Unless the macro is defined to accept a variable number of arguments:
#define M(x, ...) __VA_ARGS__ int x[2] = { M(1'2,3'4) }; // C++11: int x[2] = {}; // C++14: int x[2] = { 3'4 }; |
This is the worst kind of change in behavior, known as a silent change, the existing code compiles without complaint but has different behavior.
How much existing code contains either of these constructs? I suspect very very little human written code, maybe even none. This is the sort of stuff that is more likely to be produced by automatic code generators. But how much more likely? I have no idea.
How much benefit does the new feature provide? It certainly looks useful, but coming up with a number for the benefit is hard. I guess it has the potential to shave a fraction of a second off of the attention a developer has to pay when reading code, after they have invested in learning about the construct (which is lots of seconds). Multiplied over many developers and not that many instances (the majority of numeric literals contain a single digit), we could be talking a man year or two per year of worldwide development effort?
All of the examples I have seen require the ‘assistance’ of macros, here is another (courtesy of Jeff Snyer):
#define M(x) A ## x #define A0xb int operator "" _de(char); int x = M(0xb'c'_de); |
Are there any examples of a silent change that don’t involve the preprocessor?
How many ways of programming the same specification?
How many different ways are there of writing a program to implement a given specification? Non-trivial specifications probably have an enormous number of possible programming solutions. What about really simple specifications, say something based on the 3n+1 problem (write a programs that takes a list of integers and outputs their ‘3n+1’ length; ‘3n+1’ length algorithm: for integer  , if is even divide it by
  and assign the result to , otherwise is odd, multiply it by
  and add
  to give the new value of ; repeat the process, counting the number of iterations until reaches )?.
I can think of a dozen or so (slightly) different ways that I might write a program to solve this problem. If I really had to I could probably come up with a few hundred different solutions, but I think the source code of these programs would not look like something I would normally write. If I was to run a competition how many different answers might I get? If you twisted my arm I might have said 500. What do you think?
Meine van der Meulen studied the N-version programing for his PhD thesis (N groups independently write a program to the same specification, compare the output of the N programs and select the ‘best’ answer; cannot find a copy of the thesis online). This was empirical work and van der Meulen posted the above 3n+1 problem to a programming competition website and used the 95,497 submitted solutions for his analysis; he also kindly sent me a copy of the solutions (11,674 solutions were written in Pascal, the rest were in C).
Not all the solutions correctly solve the problem. I ignored this ‘detail’. There are also many duplicates (as in identical source code).
I am interested in differently coded solutions. I defined different as the sequence of operators/punctuators making up the program being different (or at least having a different MD5 checksum), so identifiers and comments are ignored. Should permutations in the order of independent adjacent statements really be counted as different? For the sack of keeping my life simple they current are. This definition of differently coded reduces the original 63,823 C programs down to 6,301. Wow, how are 6k+ different programs possible?
The original specification did not mention performance, but lots of developers did all sorts of weird and wonderful stuff to improve runtime performance. The most common optimization technique used (apart from some inventive ways of checking for odd/even) was to cache previous answers along with the solution for all the intermediate steps that were passed through on the way to 1 (the path from the starting value to 1 is very erratic and sometimes goes through values greater than the starting value) and check this cache to see whether it contains the current value of.
A common measure of program size is lines of code. What is the size distribution, in LOC, for these 6,301 programs? One program has been labeled an outlier and excluded from the analysis (most of its 8,345 lines were taken up with initializing a data structure with precomputed solutions).
The following plots lines of code against the number of programs containing that many lines (download code and data).
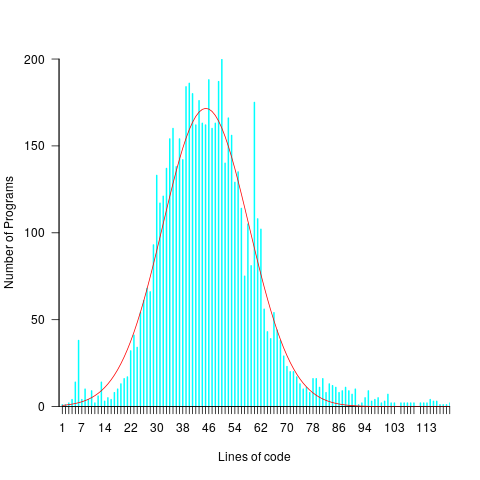
The mean program length is 46.3 lines, standard deviations 15.4. The red curve is a Normal distribution whose mean/sd has been tweaked to give a better visual fit (a Shapiro-Wilk test dispels any hope tht the distribution might be Normal). There is no reason to think that the data will be fitted by any known distribution and I’m not going to overfit on one data-point. If pushed I will wave my arms and describe the distribution as Normalish with added spikes and a fat right tail.
That spike around 60 lines is interesting. Is this group of solutions all doing the same thing but with different statement orderings? I have previously written about how gcc/llvm do a good job of turning the core of the algorithm into the same machine code. Perhaps a future version of these compilers will be able to tell us whether the programs clumping around 60 LOC are doing the same thing.
Software engineering: A great discipline for an academic fraudster
I am a sporadic reader of In the Pipeline, a blog covering drug discovery and the pharma industry, subjects about which I have no real interest but the author is a no nonsense guy whose writing I enjoy reading. A topic that regularly crops up is retraction of a published paper (i.e., effectively saying “ignore that paper we published way back when”). Reasons for retraction include a serious mistake, plagiarism of somebody else’s work or outright fabrication of data.
Retraction of papers published in software engineering journals is rare, why is that? I don’t think software engineering researchers are more/less honest than researchers in other fields. I could not find any entries on Retraction Watch.
Plagiarism certainly occurs and every now and again a paper is retracted for this reason.
Corrections to previously published papers certainly occur on a regular basis, but I don’t recall seeing a retraction because of a serious error (but then I rarely get to gossip around the coffee table in university departments and am not that well up on such goings on).
Researchers are certainly not above using the subset of a benchmark that shines the most favorable light on their work, or simply performing misleading comparisons. Researchers who do such things are seem more as an embarrassment than a threat to academic integrity, they are certainly not in the same league as those who fabricate data
Fabrication of data in software engineering? I’m sure it goes on, but unless the people responsible own up I think it is unlikely to be detected (unless the claims are truely over the top). There is no culture of replication in software engineering or of building on other peoples’ work (everybody is into doing their own thing); two very serious problems, but not the topic of this discussion.
In fact software engineering is the ideal discipline for an academic fraudster: replication is very rare, everyone doing their own thing, a culture of poor/nonexistent record keeping and experimental data is rarely kept past the replacement of the machine on which it sits (I am regularly told this when I email authors asking for a copy of their raw data for my book). Even in disciplines whose characteristics are at the other end of the culture scale, it can take a long time for fraud to be uncovered.
From time to time authors I contact tell me that the numbers appearing in the published paper are incorrect; often there is an offer of the correct numbers and sometimes a vague recollection of what they might be. Sometimes authors don’t reply to my email, is the data fake or is talking to me not worth their time (I have received replies to this effect)?
Am I worried about fraud in software engineering research? No, incorrect data in published work is more likely to occur because of clerical mistakes, laziness or incompetence.
2013 in the programming language standards’ world
Yesterday I was at the British Standards Institute for a meeting of IST/5, the committee responsible for programming languages. Things have been rather quiet since I last wrote about IST/5, 18 months ago. Of course lots of work has been going on (WG21 meetings, C++ Standard, are attracting 100+ people, twice a year, to spend a week trying to reach agreement on new neat features to add; I’m not sure how the ability to send email is faring these days ;-).
Taken as a whole programming languages standards work, at the ISO level, has been in decline over the last 10 years and will probably decline further. IST/5 used to meet for a day four times a year and now meets for half a day twice a year. Chairman of particular language committees, at international and national levels, are retiring and replacements are thin on the ground.
Why is work on programming language standards in decline when there are languages in widespread use that have not been standardised (e.g., Perl and PHP do not have a non-source code specification)?
The answer is low hardware/OS diversity and Open source. These two factors have significantly reduced the size of the programming language market (i.e., there are far fewer people making a living selling compilers and language related tools). In the good old-days any computer company worth its salt had its own cpu and OS, which of course needed its own compiler and the bigger vendors had third parties offering competing compilers; writing a compiler was such a big undertaking that designers of new languages rarely gave the source away under non-commercial terms, even when this happened the effort involved in a port was heroic. These days we have a couple of cpus in widespread use (and unlikely to be replaced anytime soon), a couple of OSs and people are queuing up to hand over the source of the compiler for their latest language. How can a compiler writer earn enough to buy a crust of bread let alone attend an ISO meeting?
Creating an ISO language standard, through the ISO process, requires a huge amount of work (an estimated 62-person years for C99; pdf page 20). In a small market, few companies have an incentive to pay for an employee to be involved in the development process. Those few languages that continue to be worked on at the ISO level have niche markets (Fortran has supercomputing and C had embedded systems) or broad support (C and now C++) or lots of consultants wanting to be involved (C++, not so much C these days).
The new ISO language standards are coming from national groups (e.g., Ruby from Japan and ECMAscript from the US) who band together to get the work done for local reasons. Unless there is a falling out between groups in different nations, and lots of money is involved, I don’t see any new language standards being developed within ISO.
Cloning research needs a new mantra
The obvious answer to software engineering researchers who ask why their findings are not applied within industry is that their findings provide no benefits to industry. Anyone who digs into the published research finds that in fact there is lots of potentially useful stuff in there, the problem is that researchers often take too narrow a perspective.
A good example of a research area that is generally ignored by industry but has potential for widespread benefits is software cloning; that is chunks of source code that are duplicated within the same application (a chunk may be as little as five lines or may be more, and the definition of duplicate varies from exactly the same character sequence, through semantic equivalence to chilling out with a certain percentage of lines being the same {with various definitions for ‘same’}). (This is not about duplication of code in multiple versions of the same product, we all know how nasty that can be to maintain).
Researchers regard cloning as bad, while I suspect many developers are neutral on the subject or even in favor of creating and using duplicate code.
Clone research will be ignored by industry while researchers continue to push the mantra “clones are bad”. It just does not gel with industry’s view.
Developers are under pressure to deliver working software; if they can save time by (legally) making use of existing code then there is an immediate benefit to them and their employer. The researchers’ argument is that clones increase maintenance costs (a fault being fixed in one of the duplicates but not the other(s) is often cited as the killer case for all clones being bad). What developers know is that most code is never maintained (e.g., is is rewritten, or never used again or works fine and does not need to be changed).
Do company’s that own software care about it containing clones? They are generally more interested in meeting deadlines and being first to market. If a product is a success it will be worth paying its maintenance costs; why risk spending extra time/money on creating a beautifully written product when most products don’t well well enough to be worth maintaining? If the software is bespoke, for in-house use or by a client, then increased maintenance costs are good for those involved in writing the software (i.e., they get paid to maintain it).
The new clone research mantra should be that clones have benefits and costs, and the research results help increase benefits and decrease costs. How does this increase/decrease work? You’re the researchers, you tell me.
My own experience with clones is that they do sometimes multiply costs (i.e., work has to be done more than once) but overall their creation and use is very cost effective, as for ‘missed’ fault fixes clones are a small subset of this use case.
I have heard of projects where there has been rampant copying, plus minor modification, of code within the project. If such projects fail then the issue is one of project management and control, with cloning being one of the consequences.
The number of clones usually found in a large software system is surprisingly high; . If you want to check out the clones in your own code CCFinder is well worth a look. The most common use for such tools is plagiarism detection.
A local CS reading group
Paper Cup, a reading group for computer science papers recently started, based about 30 minutes from me I decided to go along to the first meeting to see what it was like.
The paper under discussion was: Dynamo: Amazon’s Highly Available Key-value Store. I don’t know much about databases and and have never written code that uses a key-store, but since the event was hosted by guys at ebay/PayPal I figured there would be somebody in the room who knew what they were talking about.
The idea behind a paper reading group is that everybody agrees to read a paper before the meeting, then turns up at the meeting and discusses it.
The list of authors takes up three lines and their affiliation is simply listed as Amazon.com. As a subject matter outsider who probably reads several hundred papers a year my overall impression was that this paper was relatively information free and was more or less a puff-piece for Amazon. On the other hand it currently has 1,562 citations, a lot more than would be expected for a puff-piece paper published in 2007. I was obviously missing something.
Around 10 people showed up, with a handful sounding very knowledgeable and one person working on a new ‘Dynamo like’ implementation. Several replies to my question of what was so good about this paper, that appeared relatively content free to me, gave the reason that they were inspired by it. Wow, very few scientific papers ever inspire anybody.
The group worked its way through the paper and I tried to nod intelligently at the right time. This is one of those papers that requires lots of reading between the lines, an activity that requires lots of background knowledge and hands-on experience (as an outsider I was only reading the surface text).
I asked if one of the reasons this paper was considered to be important was because it described a commercial implementation rather than a research project. Any design team is much more likely to use techniques outlined in a paper describing a working commercial system than techniques operating in some toy academic environment (papers on Cassandra were appearing at about the same time). I’m not sure the relatively young attendees understood the importance of this point.
The take-away interesting snippet of information: Dynamo gives preference to performance over consistency, if a customer’s shopping basket key-value store becomes inconsistent then information on items added to the basket take precedence over items deleted from the basket (a sensible choice for a retailer such as Amazon).
If you live near west London and are interested in discussing CS paper do join the Paper Cup meetup group, the more the merrier.
I made a mistake, please don’t shoot me
The major difference between commercial/academic written software is the handling of user mistakes, or to be more exact what is considered to be a user mistake. In the commercial world the emphasis is on keeping the customer happy, which translates into trying hard to gracefully handle any ‘mistake’ the user makes. Academic software is generally written to solve a research problem and is often very unforgiving of users failing to keep to the undocumented straight and narrow; given the context this unforgiving behavior is understandable, but sometimes such software is released to an unsuspecting world.
The R archive of contributed packages, CRAN, is a good example of the academic approach to writing software. I am an active user of many packages in this archive and its contributors have my heart-felt thanks. But on a regular basis I make a mistake when calling a function in one of these packages, get shot in the foot and am not best pleased.
What makes the situation worse is that my mistakes are often so trivial and easy to fix (by both me or the package authors). My most common ‘mistake’ is passing an argument whose type is not handled by the function, e.g., passing a data-frame to diag (why do I have to convert the argument using as.matrix, when diag could spot my mistake and do the conversion for me instead of returning some horrible mess).
Commercial software can also be unforgiving of user mistakes; in fact early versions of a lot of commercial software is just as unfriendly as academic software. The difference is that the commercial managers will make it their business to ensure that developers fix the code to make it user friendly. Competition ensures that those who don’t listen to their users go out of business.
Updating code to gracefully handle user mistakes is often a chore and many developers hate having to do it, managers are needed to prod developers into doing the work. The only purpose for more than half of the code in a commercial product may be to handle user mistakes and the percentage can approach 90%.
A lot of Open Source software has significant commercial backing, e.g., Linux, Apache, Firefox and gcc/llvm, which means it is somebody’s job to make sure customer complaints are addressed.
What the R development team needs is more commercial backing (it appears to have very little, but I may be wrong). Then somebody can be hired to go through the popular packages to make then mistake friendly, feed the changes back to the original author and generally educate package developers about bullet proofing their code.
Amount of end-user usage of code in Firefox
How much end-user usage does the code in Firefox receive over time?
Short answer: The available data is very sparse and lots of hand waving is needed to concoct something.
The longer answer is below as another draft section from my book Empirical software engineering with R. As always, comments and pointers to more data welcome. R code and data here.
Suggestions for alternative methods of calculation also welcome.
Amount of end-user usage of code in Firefox
Source code that is never executed will not have any faults reported against it while code that is very frequently executed is more likely to have a fault reported against it than less frequently executed code.
The Firefox browser has been the subject of several fault related studies. The study by Massacci, Neuhaus and Nguyen is of interest here because it provides the information needed to attempt to build a fault model that takes account of the total amount of usage that code experiences from all end-users of a program. The data used by the study applies to 899 Mozilla Firefox-related Security Advisories (MFSA, a particular kind of fault), noting the earliest and latest versions of Firefox that exhibits each fault; six major releases (i.e., versions 1.0, 1.5, 2.0, 3.0, 3.5 and 3.6) were analysed; the amount of code in each version that originated in earlier versions was measured (see plot below).
Massacci et al make their raw data available under an agreement that does not permit your author to directly distribute it to readers;; the raw data for the following analysis was reverse engineered from the Massacci et al paper; or obtained from other sources.
The following analysis is an attempt to build a model of amount of Firefox code usage, by end-users, over time, i.e., number of lines of Firefox source code being executed per unit time summed over all end-users at a given moment in time. The intent is to couple this model with fault data, looking for a relationship of the form: an X% change in usage results in a Y% change in reported faults.
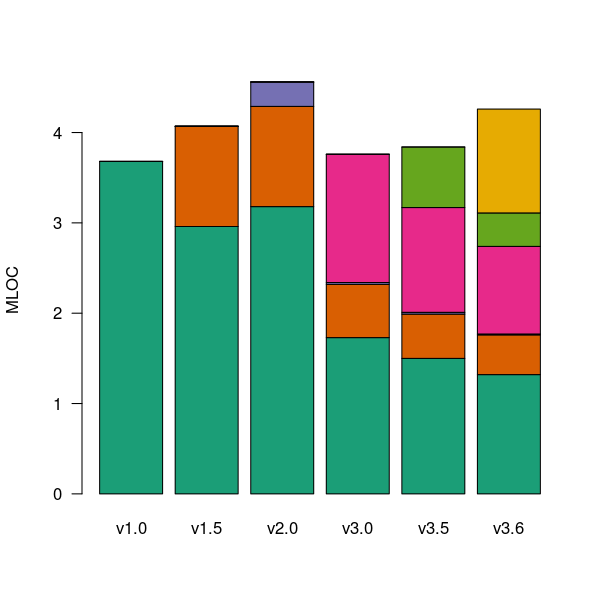
Figure 1. Amount of source (millions of lines) in each version, broken down by the version in which it first appears. Data from Massacci, Neuhaus and Nguyen <book Massacci_11>.
As expected, a large amount of code from previous versions appears in later versions.
Since we are interested in the relationship between end-user code usage and faults (MFSAs in this case) we are only interested in versions of Firefox that are actively maintained by Mozilla. Every version has a first official release date and an end-of-support date beyond which no faults reported against it are fixed; any usage of a version after the end-of-support date is not of interest in this analysis.
How many people are using each version of Firefox at any time?
A number of websites list information on Firefox market share over time (as a percentage of all browsers measured), but only two known to your author break this information down by Firefox version. Massacci et al used url[netmarketshare.com] for Firefox version market share (data going back to November 2007), but your author found it easier to obtain information from url[www.w3schools.com] (data going back to May 2007). The W3schools data is obtained from the log of visitors to their site, which will obviously be subject to fluctuations (of unknown magnitude).
For the period November 2004 to April 2007 the market share of each Firefox version was estimated as follows:
- total Firefox market share was based on that listed by url[marketshare.hitslink.com]
- during the period when only version 1.0 was available, its market share was assumed to be the total Firefox market share,
- the market share for versions 1.5 and 2.0 was assumed to follow the trend of growth and decline seen in later releases for which data is available. Numbers were concocted that followed the version trend and summed to the known total market share.
The plot below shows the market share of the six versions of Firefox between official release and end-of-support. Estimated values appear to the left of the vertical red line, values from measurements to the right. It can be seen that at its end-of-support date version 2.0 still had a significant market share.
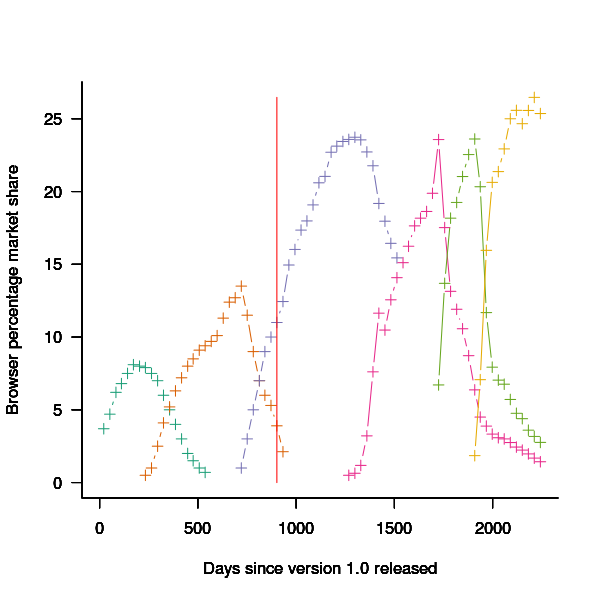
Figure 2. Market share of Firefox versions between official release and end-of-support. Data from url[www.w3schools.com].
The International Telecommunications Union publishers an estimate of the number of people per 100 head of population with Internet access for each year between 2003 and 2011 <book ITU_12>; the data is broken down by developed/developing countries and also by major world regions. Assuming that everybody who users the Internet uses a browser, this information can be combined with market share and human population data to estimate the number of Firefox users.
The ITU do not provide much information about how the usage figure is calculated or even which month of the year it applies to (since we are interested in change over time, knowing the month is not important and the start of the year is assumed). As the figure below shows the estimate over the period of interest can be accurately modeled by a straight line. A linear model was fitted to the data to predict usage between published estimates; over the period of interest the rate of growth in the Developed world has been almost twice as great as the rate in the whole world.
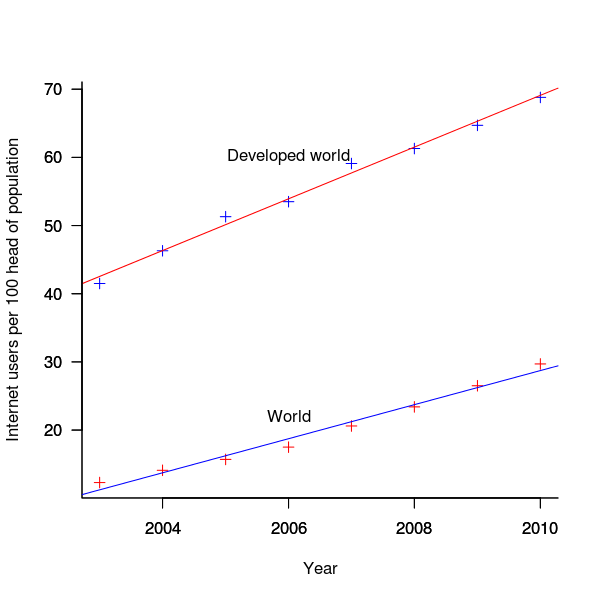
Figure 3. Number of people with Internet access per 100 head of population in the developed world and the whole world. Data from ITU <book <ITU_12>.
We are interested in relative change in total user population, and this can be obtained by multiplying the per-head of population value by the change in population (a 0.8% yearly growth is assumed for the developed world).
Possible significant factors for why the formula  might not accurately reflect the probability of a MFSA being reported include:
- the characteristics of people who started using the Internet in 2004 may be different from those who first started in 2010:
- there will be variation in the amount of time people spend browsing, does the distribution of time usage differ between early and late adopters?
- some people are more likely than others to report a fault (e.g., my mum is a late adopter and extremely unlikely to report a fault, whereas I might report a fault),
- there may be significant regional differences, e.g., European users vs. Chinese users. These differences include the Internet sites visited (the behavior of Firefox will depend on the content of the web page visited) and may affect their propensity to report a problem (e.g., do the cultural stereotypes of Chinese acceptance of authority mean they are unlikely to report a fault while those noisy Americans complain about everything?)
The end-user usage for code originally written for a particular version, at a point in time, is calculated as follows:
- number of lines of code originally written for a particular version that is contained within the code used to build a later version, or that particular version; call this the build version,
- times the market share of the build version,
- times the number of Internet users of the build version (users in the Developed world was used).
The plot below is an example using the source code originally written for Firefox version 1.0. The green points are the code usage for version 1.0 code executing in Firefox build version 1.0, the orange points the code usage for version 1.0 code executing in build version 1.5 and so on to the yellow points which is the code usage for version 1.0 code executing in build version 3.6. The black points are the sum over all build versions.
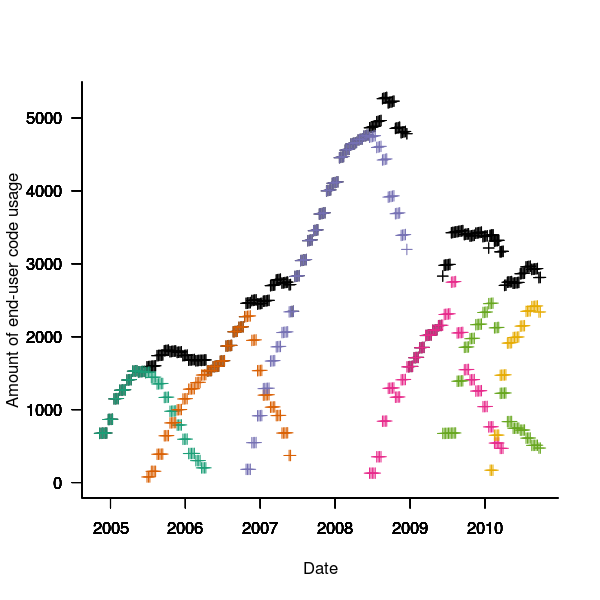
Figure 4. Amount of end-user usage of code originally written for Firefox version 1.0 by various other versions.
Much of the overall growth comes from growth in Internet usage, and in the early years there is also substantial growth in browser market share.
An analysis that attempts to connect Firefox usage with reported MFSAs will appear shortly (it would be surprising if fault report rate scaled linearly with end-user usage).
Unique bytes in a sliding window as a file content signature
I was at a workshop a few months ago where a speaker pointed out a useful technique for spotting whether a file contains compressed data, e.g., a virus hidden in a script by compressing it to look like a jumble of numbers. Compressed data contains a uniform distribution of byte values (after all, compression is achieved by reducing apparent information content), your mileage may vary between compression techniques. The thought struck me that it would only take a minute to knock up an R script to check out this claim (my use of R is starting to branch out into solving certain kinds of general coding problems) and here it is:
window_width=256  # if this is less than 256 divisor has to change in call to plot

plot_unique=function(filename)
{
t=readBin(filename, what="raw", n=1e7)

# Sliding the window over every point is too much overhead
cnt_points=seq(1, length(t)-window_width, 5)

u=sapply(cnt_points, function(X) length(unique(t[X:(X+window_width)])))
plot(u/256, type="l", xlab="Offset", ylab="Fraction Unique", las=1)

return(u)
}

dummy=plot_unique("http://shape-of-code.com/2013/05/17/preferential-attachment-applied-to-frequency-of-accessing-a-variable/")

dummy=plot_unique("http://www.shape-of-code.com/R_code/requirements.tgz") |
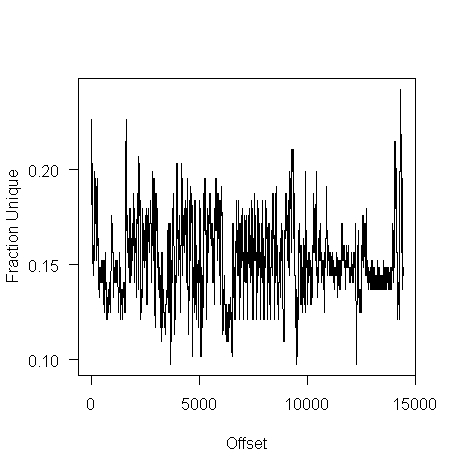
The unique bytes per window (256 bytes wide) of a HTML file has a mean around 15% (sd 2):
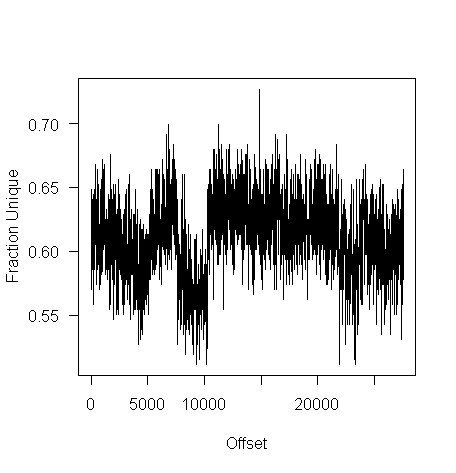
while for a tgz file the mean is 61% (sd 2.9):
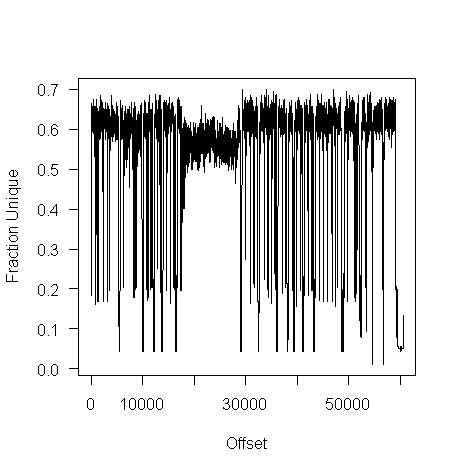
I don’t have any scripts containing a virus, but I do have a pdf containing lots of figures (are viruses hidden in pieces all all together?):
Do let me know if you find any interesting ‘unique byte’ signatures for file contents.
Recent Comments