Archive
Hack, a template for improving code reliability
My sole prediction for 2014 has come true, Facebook have announced the Hack language (if you don’t know that HHVM is the Hip Hop Virtual Machine you are obviously not a trendy developer).
This language does not follow the usual trend in that it looks useful, rather than being fashion fluff for corporate developers to brag about. Hack extends an existing language (don’t the Facebook developers know about not-invented-here?) by adding features to improve code reliability (how uncool is that) and stuff that will sometimes enable faster code to be generated (which has always been cool).
Well done Facebook. I hope this is the start of a trend of adding features to a language that help developers improve code reliability.
Hack extends PHP to allow programmers to express intent, e.g., this variable only ever holds integer values. Compilers can then check that the code follows the intent and flag when it doesn’t, e.g., a string is assigned to the variable intended to only hold integers. This sounds so trivial to be hardly worth bothering about, but in practice it catches lots of minor mistakes very quickly and saves huge amounts of time that would otherwise be spent debugging code at runtime.
Yes, Hack has added static typing into a dynamically typed language. There is a generally held view that static typing prevents programmers doing what needs to be done and that dynamic typing is all about freedom of expression (who could object to that?) Static typing got a bad name because early languages using it were too disciplinarian in a few places and like the very small stone in a runners shoe these edge cases came to dominate thinking. Dynamic languages are great for small programs and showing off to spotty teenagers students, but are expensive to maintain and a nightmare to work with on 10K+ line systems.
The term gradual typing is a good description for Hack’s type system. Developers can take existing PHP code and gradually give types to existing variables in a piecemeal fashion or add new code that uses types into code that does not. The type checker figures out what it can and does not get too upperty about complaining. If a developer can be talked into giving such a system a try they quickly learn that they can save a lot of debugging time by using it.
I would like to see gradual typing introduced into R, but perhaps the language does not cause its users enough grief to make this happen (it is R’s libraries that cause the grief):
- Compared to PHP’s quirks the R quirk’s are pedestrian. In the interest of balance I should point out that Javascript can at times be as quirky as PHP and C++ error messages can be totally incomprehensible to everybody (including the people who wrote the compiler).
- R programs are often small, i.e., 100 lines’ish. It is only when programs, written in dynamically typed languages, start to exceed around 10k+ lines that they start to fall in on themselves unless that one person who has everything in his head is there to hold it all up.
However, there is a sort of precedent: Perl programs tend to be short (although I don’t think they are as short as R) and it gradually introduced the option of stronger typing. But Perk did/does have one person who was the recognized language designer who could lead the process; R has a committee.
By now I ought to feel more knowledgeable about R
I was surprised to find recently that there are now over 15,000 lines of R code in the book I am working on. If I had written that much code in another ‘newly’ acquired language I would probably feel a lot more knowledgeable about it than I currently feel about R. Why don’t I feel more knowledgeable about R?
Those 15,000 lines are not all real lines, lots of cut-and-paste has been going on; yes, R is a cut-and-paste language just like Cobol and ‘web’ languages. ‘Real’ programmers often look down their noses at such languages, but that is just a failure on their part to understand what they are really all about. Perhaps I have written 5,000 actual lines of R, still a decent amount and half way to the 10,000 line minimum I ask newbies if they have reached.
An expert in a language should be able to pick up a random sample of code and to have been there, done that and got the t-shirt. I still regularly learn new stuff when reading other people’s code, so I’m still a long way from being an R expert. But then R is in the mold of a functional language and one characteristic of languages in this mold is that they provide umpteen different ways of doing the same thing. The combination of this language characteristic along with the lack of common culture in R usage (when this exists it significantly reduces the patterns of code usage commonly encountered) could mean that I am on the treadmill of forever and regularly learning new R coding techniques (which is great source for blog articles but gets tedious after a while); Perl is a lot like this.
As a compiler guy I’m used to learning a language by reading the language definition. Reading this document gives me a warm fuzzy feeling of knowing the language, this has nothing to do with being able to program in it and there is no way of knowing that I understood what the words meant. I was going to say that the R language definition was little more than some brief notes jotted down by somebody to be written up later, but checking the link to the page I discovered that somebody had been spending time significantly improving on what existed a few years ago; there is still a way to go but the R language definition is starting to look respectable. Hopefully my feeling of R knowledgeability will improve after I have read through this updated definition a few times.
Use of R is usually intimately bound up with the data being manipulated; on a per line of code basis much more so than other languages (in this regard it is like Cobol). Perhaps the need to have to learn lots more about the data than I normally have to adds to my feeling of not knowing. Would my feeling of knowledgeability increase if I worked with the same kind of data ll the time?
Performing a non-local return in R
In most languages return is a statement, but in R it is a function (in fact R does not really have statements, it only has expressions). This function-like behavior of return is useful for figuring out the order in which operations are performed, e.g., the value returned by return(1)+return(2) tells us that binary operators are evaluated left to right.
R also supports lazy evaluation, operands are only evaluated when their value is required. The question of when a value might be required is a very complicated rabbit hole. In R’s case arguments to function calls are lazy and in the following code:
ret_a_b=function(a, b) { if (runif(1, -1, 1) < 0) a else b } helpless=function() { ret_a_b(return(3), return(4)) return(99) } |
a call to helpless results in either 3 or 4 being returned.
This ability to perform non-local returns is just what is needed to implement exception handling recovery, i.e., jumping out of some nested function to a call potentially much higher up in the call tree, without passing back up through the intervening function called, when something goes wrong.
Having to pass the return-blob to every function called would be a pain, using a global variable would make life much simpler and less error prone. Simply assigning to a global variable will not work because the value being assigned is evaluated (it does not have to be, but R chooses to not to be lazy here). My first attempt to get what I needed into a global variable involved delayedAssign, but that did not work out. The second attempt made use of the environment created by a nested function definition, as follows:
# Create an environment containing a return that can be evaluated later. set_up=function(the_ret) { ret_holder=function() { the_ret } return(ret_holder) } # For simplicity this is not nested in some complicated way do_stuff=function() { # if (something_gone_wrong) get_out_of_jail() return("done") } get_out_of_jail=0 # Out friendly global variable control_func=function(a) { # Set up what will get called get_out_of_jail <<- set_up(return(a)) # do some work do_stuff() return(0) } control_func(11) |
and has the desired effect 🙂
Prompt Parking near Buckingham Palace
I was at the Urban Data Hack at the weekend run by Data Science London (doing their usual excellent job of feeding and watering us). Team Prompt Parking (me, Manoj, Lusine and Bob {of team Outlier fame}) created an App (try it) that gives drivers directions to the closest locations, in Westminster, most likely to have an empty parking space, taking into account preferences for space actually being available, distance to drive and probability of experiencing vehicle/personal crime close to the parking bay.
The default starting location is the official London residence of the Queen, which is in Westminster (most of the data came from Westminster City Council), and can be changed by entering latitude/longitude at the top of the page; in practice it would use the current location reported by the phone gps.
How does the App work? Based on your current location, day of week and time of day, it obtains data on ‘close’ parking bays (precomputed data; see below), applies the user preferences to the bay data to obtained a weighted preference for each bay, picks the four bay locations with the highest weight and feeds these locations into Google maps to draw the route.
The precomputed data included (code and data):
- mean number of empty parking spaces within every 15 minute window of a given day of the week (the week was assumed to be the only parking related cycle). The parking dataset included every parking transaction in Westminster between April 2013 to January 2014; the 861 megabyte file containing 6,967,793 transactions was boiled down to 49M using
awkto split the data up, one file per parking location, making it practical to run anRscript on each file to do the averaging (we also calculated a standard deviation which never got integrated into the weighting), - likelihood of crime against vehicles and people. The crime data included a lat/long and the ‘influence’ of each recorded crime (i.e., the likelihood of another crime being committed nearby) was assumed to have a gaussian distribution having a mean of 200 meters (chosen by a couple of white guys staring at the ceiling). The crime data was monthly and sparse (good for citizens but bad for data analysis) and ended up being amalgamated to an overall number per parking location per year (i.e., the gaussians for each crime ‘influence’ were summed over the area of Westminster),
- the distance, along streets (not flying crows), to every parking bay was calculated from 50 ‘red spots’ (these spots were chosen to be well distributed over major routes within Westminster). The App takes the user’s location and calculates the closest red spot to use for parking bay distance information.
- the data included parking cost information but we did not get around to including that in the App
The hack had prizes for various categories. Team Prompt Parking received 1st Prize for Urban Data Integration, which surprised me as I thought we were the best in some of the other categories. My heart sank when I saw the Team DeTile App (the team’s Italian accent may have thrown my spelling) which combined crime data with a property company’s API to produce a flat (apartment in the US) finder recommender running on a phone; they deserved to win the Best App category.
Team Prompt Parking did not consider how money might be made from the App; our submission report included crowd pleasing concepts such as reducing CO2 emissions and accident rates by reducing driving time to find an empty parking space. Having drivers look at ads displayed in the App would probably increase accidents.
A more promising money making App, using this data, would target traffic wardens; the data shows a higher empty bay rate than that experienced by the central London drivers I spoke to at the weekend (some obvious human biases spring to mind here). There is an opportunity here for a startup to offer traffic wardens routes tailored to maximize the number of parking tickets per hour; the company would take a percentage of the warden’s earnings.
The main lesson learned was not to create large databases in the cloud during a short hack. While one database containing all the data is a good idea in theory, in a 24 hour hackathon there is not a lot of time to iterate when database creation goes wrong (which everybodies did, several times). It is better to do as much as possible on local laptops (I split the 860M data file into smaller chunks using a local awk script rather than load it into a cloudy sql database that I then had to access remotely).
We had a separate database for each dataset, making it quick to iterate changes to each dataset and not creating dependencies that held up testing using the other datasets.
Adverts during compilation; the future for gcc and llvm?
Many of the larger open source projects have most of their manpower supplied by commercial companies. Companies pay developers to work on open source projects because it is in their interest to do so. The current level of funding will not last forever and some open source projects will either have to significantly slim down their operations or find other revenue streams.
For the last few years (and probably the next few) Mozilla obtained most of its funding from Google through a licensing agreement (Google is the default search engine in the search box). No company wants to be dependent on a single source for a large chunk of its income and Mozilla is no exception. But where are the review streams for open source companies? Training and consulting are the obvious choices for technical products, but web browsers are supposed to user friendly, not technical. Another option is advertising and Mozilla has indicated an intent to go down this path.
How are open source compilers funded? A lot of the work on gcc used to be done by the folk at Code Sourcery, which is not owned by Mentor Graphics, and I was told their income primarily came from companies interested in ports to new processors and platforms. I have no idea how the gcc group is funded inside Mentor Graphics, but the long term prognosis does not look good; there is a long history of large tech companies buying compiler outfits and closing them down some years later (because the income they produce is not worth the hassle). The LLVM project, I’m told, gets most of its funding from Apple and one of my predictions for 2009 was that this funding would go away and LLVM would die; ok I was wrong about the year, but eventually Apple will stop funding this project.
Advertising is a possible revenue stream for compiler vendors; compilers could show adverts while compiling. Anybody who has used a commercial compiler will be familiar with the copyright notices that appear at the start of every compilation, so having a text message appear at the start of every compile is not new. Advertising could take the form of product placement “This version of gcc is brought to you by Wizzo Wash” or display material downloaded during compilation.
Adverts during compilation are not going to be popular with developers. One solution is to offer a subscription service for an ads free version of the compiler. It will certainly be necessary to make it much more difficult to build the compiler from source.
This form of revenue generation will have to be sold to developers; a group not known for its willingness to pay for tools (new tool vendors quickly learn to sell to management and ignore developers) combined with compiler writers not being known for having any selling ability.
Honking the horn for go faster memory (over go faster cpus)
I have been doing some analysis of computer performance, as measured by the results of the SPEC 2006 int benchmark (i.e, no floating point). As the following plot shows, computers are continuing to get faster (code and data):
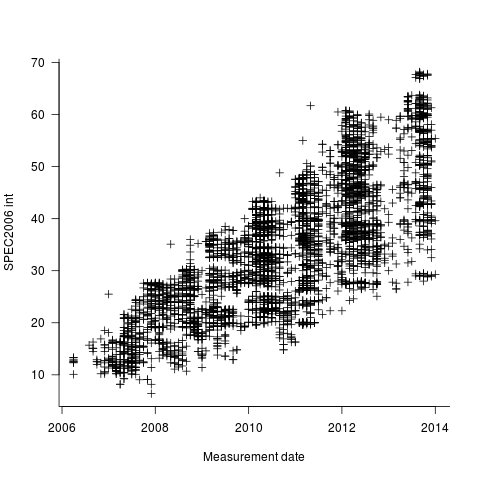
I think the widening spread of results might have a lot to do with companies slowly migrating to the newer benchmark, increasing the range of test cases; there mus also be an element of an increasing range of computer performance on offer from vendors now we have reached the good-enough point.
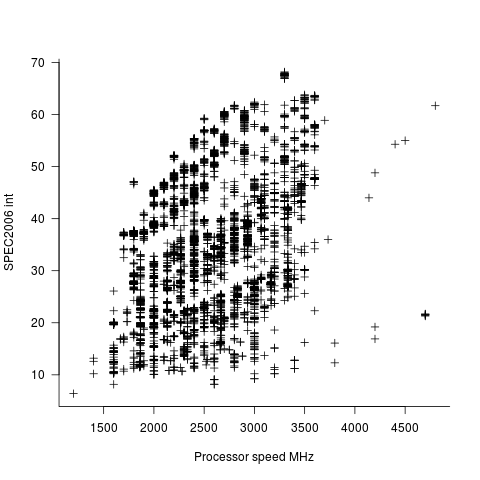
In the last century the increase in performance was strongly correlated with increasing cpu clock speed. As the following plot shows, this century is different (in years to come the first few years, where this correlation quickly died out, will be treated as a round-off error); performance is more likely to be higher at a higher clock rate, but far from guaranteed:
One of the reasons for this change is that, for many tasks, cpus are now seriously performance limited by memory bandwidth, and so these days a lot of the performance improvement is coming from faster memory (yes, it is really about shifting more bytes per clock tick, but a common faster/slower vocabulary keeps things simpler). The following plot uses PC2 (blue) and PC3 (red) module numbers:
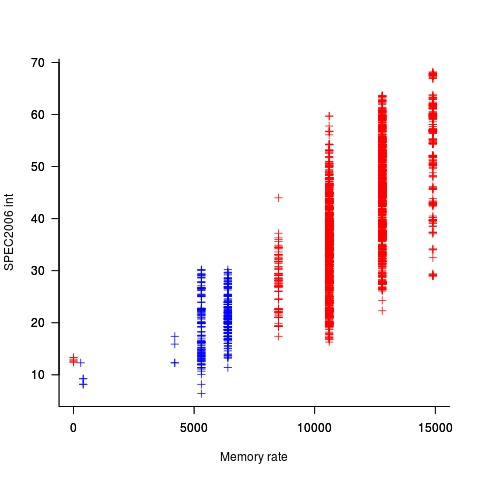
Making use of go faster memory is not as straight-forward as using a go faster cpu. Memory chip configuration includes more tuning options than cpus, which just need a faster clock. That spread in performance, for a given memory rate can probably be traced to use of different options and of course cpu caches play an important part in improving performance. The SPEC results do contain lots of descriptive details about cache characteristics, but extracting it will be fiddly and analysing this kind of stuff always makes my head hurt.
The computer buying public have learned that higher clock rate is better. Unfortunately they still think this applies to cpus when they should now be asking about memory speed. When I ask people about the speed of memory in their computer I am usually told how many gigabytes it has, or get the same kind of look I used to get many years ago when asking about cpu speed.
Tool for tuning the use of floating-point types
A common problem when writing code that performs floating-point arithmetic is figuring out which of the available three (usually) possible floating-point types to use (e.g., float, double or long double). Some language ‘solve’ this problem by only having one possibility (e.g., R) and some implementations of languages that offer three types use the same representation for all of them (e.g., 32 bits).
The type float often represents the least precision/range of values but occupies the smallest amount of storage and operations on it have traditionally been the fastest, type long double often represents the greatest precision/range of values but occupies the most storage and operations on it are generally the slowest. Applying the Goldilocks principle the type double is very often selected.
Anyone who has worked with floating-point values will be familiar with some of the ways they can bite very hard. Once a function that uses floating-point types is written the general advice is to leave it alone.
Precimonious is an interesting new tool that searches for possible performance/accuracy trade-offs; it randomly selects a floating-point declaration, changes the type used, executes the resulting program and compares the output against that produced by the original program. Users of the tool specify the maximum error (difference in output values) they are willing to accept and Precimonious searches for a combination of changes to the floating-point types contained within a program that result in a faster program that does not exceed this maximum error.
The performance improvements cited in the paper (which includes the doyen of floating-point in its long list of authors) cluster around zero and worthwhile double figure percentage (max 41.7%); sometimes no improvements were found until the maximum error was reduced from  to
to  .
.
Perhaps a combination of Precimonious and a tool that attempts to improve accuracy is the next step 🙂
There is resistance to using search based methods to fix faults. Perhaps tools like Precimonious will help developers get used to the idea of search assisted software development.
I wonder how long it will be before we see commentary in bug reports such as the following:
- that combination of values was not in the Precimonious test set,
- Precimonious cannot find a sufficiently optimized program within the desired error tolerance for that rarely seen combination of values. Won’t fix.
Changes in the API/non-API method call ratio with program size
Amount of code is the fundamental metric of software engineering. How do things change as the amount of code changes and often just as interestingly what does not change with code size?
Most languages include some kind of base library functionality. Languages such as Java and C++ not only include a very large library but also a huge, widely used, collection of third-party libraries.
Let’s count every method call in lots of Java programs and for each program divide these calls into two groups, calls to methods in well-known libraries (call these the API methods) and all other method calls (i.e., calls to methods written by the developers who wrote each of the programs measured; call these the non-API methods).
I would expect the ratio of API to non-API method calls to be independent of program size.
Yes, the number of possible different API calls is fixed while the number of possible non-API calls increases with program size, but I don’t see why a changing ratio of unique calls should change the ratio of total calls.
Yes, larger programs are likely to contain more architectural stuff whose code is more likely to contain calls to non-API methods, but the percentage of architectural code is very small and unlikely to have much impact on the overall numbers.
The authors of the paper: Large-scale, AST-based API-usage analysis of open-source Java projects made their data available and so I got to check out my thinking 🙂
The plot below shows everything going to plan until around 10,000 method calls (about 50,000 lines of code). Why that sudden kink in the line (code and data)?
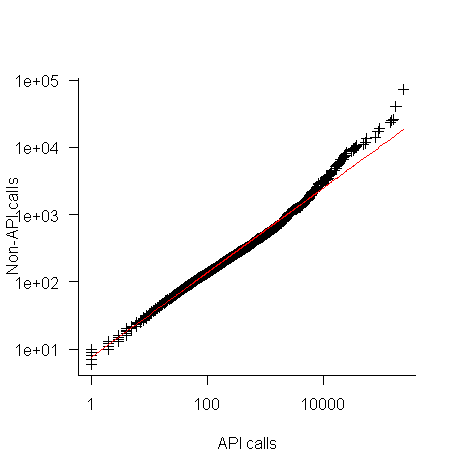
One possibility is that once a program gets to a size of around 50,000 lines the developers decide to invest in one or more wrapper packages which create a purpose built interface to an API (programs often have their own requirements and needs that existing an existing API interface does not quite meet); this would cause API calls to decrease and non-API calls to increase. If this pattern of usage occurred there would be a permanent change in the API/non-API ratio, and in practice the ratio change appears to be temporary.
I’m a bit stumped by this behavior. Suggestions on possible mechanisms welcome.
I wish I had the time to investigate, but I have a book to finish.
A prediction for 2014
When I first started writing this blog I used to make prediction for the coming year. After a couple of years I stopped doing this, the world of computer languages changes very slowly, i.e., I was mostly proved wrong.
I recently realised that Facebook had not yet launched their own general programming language; such an event must be a sure fire prediction for 2014.
Stop trying to argue that the world does not need a new programming language. The reason companies launch their own language is self image (in the way Hollywood superstars launch their own perfumes and fashion lines).
Back in the day IBM launched PL/1, we had Ada from the US DOD, C# and F# from Microsoft, Google has Go and Mozilla has Rust.
Facebook has a software platform and I’m sure they feel something is missing. It must really gall their engineers to hear people from Google, Mozilla and even that old fogy Microsoft talking about ‘their’ language.
New languages are easy to invent, PhD students do it all the time. Implementing them is also cheap, a good engineer can put together a compiler and interpreter in about a year; these days, thanks to LLVM, the cost of building a machine code generator for a new language has dropped significantly (GCC is still intimidating). Libraries, where a large percentage of the work used to go, can be copied from a multitude of places (not a problem if everything is open sourced, which new language implementations tend to be these days).
One end of year tit-bit is that Google now seem to be taking Dart more seriously than just techy swagger.
Recent Comments