Archive
Classification of code updates
Version control systems usually include support for classifying each check-in as being a particular instance of some category, e.g., Adaptive, Corrective, Perfective, or Other (this software maintenance category has a long history).
Categories have been studied for over 2,000 years. Categories is the first subject of Aristotle’s six works on logical analysis and dialectic.
Categorization is used to perform inductive reasoning (i.e., the derivation of generalized knowledge from specific instances), and also acts as a memory aid (about the members of a category). Categories provide a framework from which small amounts of information can be used to infer, seemingly unconnected (to an outsider), useful conclusions.
Experimental work on human classification has produced a variety of theories. See “Classification and Cognition” by W. K. Estes for an evidence-based analysis.
The evidence clearly shows that the boundaries between different members of a category are fuzzy. How consistent are developers in assigning software activities to the same instance of a category?
The study Determining the Distribution of Maintenance Categories: Survey versus Measurement by Schach, Jin, Yu, Heller, and Offutt, asked two people to categorise 215 maintenance changes involving the first 20 versions of Linux. The rows/columns in the table below show the number of changes assigned to each category by each person:
Adaptive Corrective Perfective Other Total Adaptive 2 0 0 0 2 Corrective 0 82 16 0 98 Perfective 0 5 99 2 106 Other 0 0 0 9 9 Total 2 87 115 11 215 |
The terminology used in the statistics analysis of agreement uses the term “raters” to refer to the people who classify items into categories. Cohen’s Kappa,  , is a measure of agreement between two raters (not more), which varies from zero (i.e., raters chose at random) to one (perfect agreement). For this data (code+data):
  , which is very good agreement between the two raters.
Another classification dataset is described in the paper Two datasets of defect reports labelled by a crowd of annotators of unknown reliability by Hernández-González, Rodriguez, Inza, Harrison, and Lozano, where five unspecified people classified two defect datasets (the paper had five authors, hmm; the associated paper does not use any established statistical technique to measure rater agreement {the paper’s really about something else}), one containing 962 defects from the Compendium project, and the other 675 defects from the Mozilla project.
The study used the Orthogonal defect classification (ODC) defect impact classification (ODC involves eight different classifications, some easier to assign than others), which contains 13 impacts, i.e., Bug, Capability, Documentation, Feature, Installability, Integrity/Security, Migration, Performance, Reliability, Requirements, Standards, Support, Usability. The Mozilla data does not contain instances of three defect impacts: Serviceability, Standards, and Accessibility.
Conger’s kappa is an extension of Cohen’s kappa to handle more than two raters, and is applicable when all raters classify all items (which they do here). Fleiss’s kappa is the brand-name technique for this kind of data, and does not require that all raters classified all items. This experimental design matches the assumptions made in the derivation of Conger’s kappa, and do not match those made for Fleiss’s kappa.
The 95% confidence intervals for the two sets of agreements between five-raters are (code+data): 0.26 to 0.29 (962 items) and 0.28 to 0.33 (675 items). Both have fair to poor agreement.
I was not surprised by the poor inter-rater agreement for these two datasets. There is a lot of domain specific knowledge is needed to assign some of the members of the ODC defect impact classification, e.g., Installability and Migration. As outsiders (I assume), the raters in this study only had the text associated with the defect report to make their decision.
Does ODC only achieve the claimed benefits if the people using it have been trained so that their agreement rate is higher? I am not aware of any other studies comparing ODC defect classification consistency. But then, studies like this rarely get done anyway.
Naming convergence in a network of pairwise interactions
While naming and categorizing things are perhaps the two most contentious issues in software engineering, there is often a great deal of similarity in the names and categorizes used by unconnected groups. These characteristics of naming and categorization are general observed behaviors across cultures and languages, with software engineering being a particular example.
Studies have found that a particular name for a thing is likely to become adopted by a group, if around 25% of its members actively promote the use of the name. The terms tipping point and critical mass have been applied to the 25% quantity.
What factors could cause 25% of the members of a group to select a particular name, and why does a tipping point occur at around this percentage?
The paper Experimental evidence for scale-induced category convergence across populations by Douglas Guilbeault (PhD thesis behind the paper), Andrea Baronchelli, and Damon Centola experimentally investigated factors that can cause a name to be adopted by 25% of a group’s members, and the researchers proposed a model that exhibits behavior similar to the experimental results (the supplement contains the technical details).
The experiment asked subjects to play the “Grouping Game”. The 1,480 online subjects were divided into networks containing either 2, 6, 8, 24 or 50 members. The interaction between members of a network only occurred via randomly selected pairs (the same pair for the network of two), with one person designated as the speaker and the other as the hearer. A pair saw three randomly selected images, such as the one below. For the speaker only, one of the images was highlighted, and they had to give a name containing at most six characters to the image. The hearer saw the name given by the speaker to one of the images, and had 30 seconds to choose the image they considered to have been named. If the image selected by the hearer was the one named by the speaker, both received a small payment, otherwise an even smaller amount was deducted from their final payment. Each subject played 100 rounds with the randomly chosen members of their network.

The images were created as a series of 50+ distinct patterns whose shape slowly morphed along a continuum, as in the following image:

The experimental results were that larger networks converged to a consistent, within group, naming of the images (using a few names), while smaller groups rarely converged and used many different names. The researchers proposed that as the network size grew, common names were encountered more often than rarer names, increasing the likelihood of reaching a tipping point. This behavior is similar to the birthday paradox, where there is a 50% probability that in a room of 23 people, two people will share the same birthday.
In the experiment, some networks included confederates trained to use a small subset of names, i.e., the researchers created a common set of names. It was hypothesized built-in human preferences would produce common patterns in the real world that, for larger groups, would cause tipping points to occur, amplifying the more common patterns to become group norms.
The supplement to the paper develops a theoretical model based on the probability of  identical items being contained in a sample of
  items, when sampling without replacement. The solution involves the hypergeometric distribution, which is difficult to deal with analytically, so simulation is needed. The results show a tipping point at around 25%.
The plot below shows a density plot for one 50-subject network over 15 trials (after 100 rounds of pairwise interaction), with each color denoting one of the 14 chosen names (height of the curve denotes likelihood of the same name being chosen for that image; code and data):
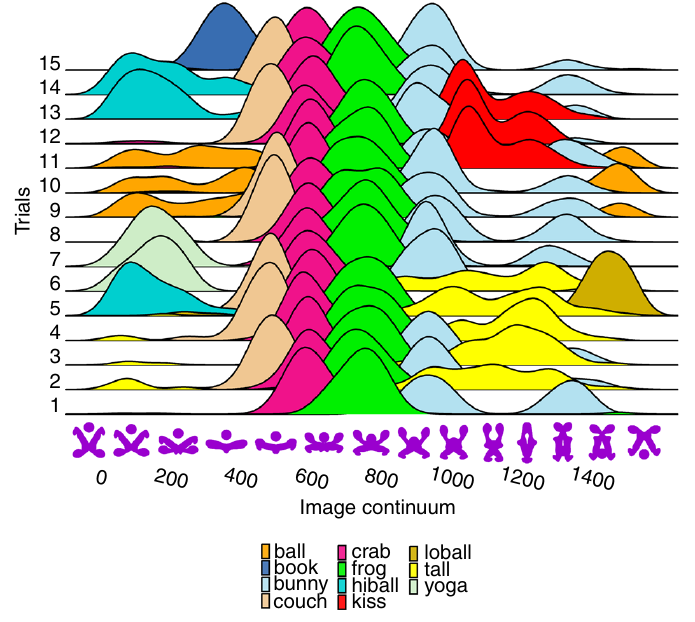
This plot shows that the same name is often used across trials, and naming boundaries between some images.
The plot below shows a density plot for one 2-subject network over 15 trials (after 100 rounds of pairwise interaction), with each color denoting one of the 72 chosen names (height of the curve denotes likelihood of the same name being chosen for that image; code and data):
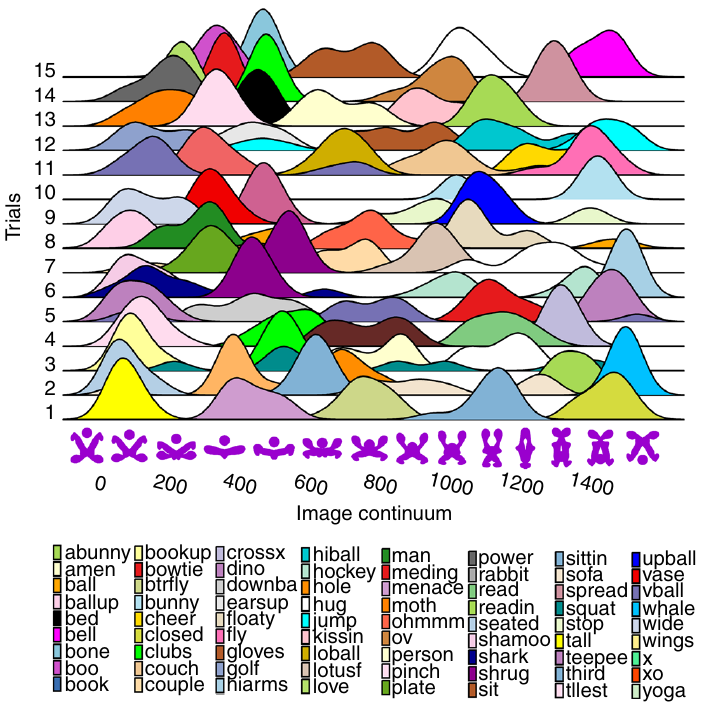
Here there is no consistent naming across trials, a much greater diversity of names appearing, and no obvious naming boundaries between images.
Recent Comments