Archive
Push hard on a problem here and it might just pop up over there
One thing I have noticed when reading other peoples’ R code is that their functions are often a lot longer than mine. Writing overly long functions is a common novice programmer mistake, but the code I am reading does not look like it is written by novices (based on the wide variety of base functions they are using, something a novice is unlikely to do, and by extrapolating my knowledge of novice behavior in other languages to R). I have a possible explanation for these longer functions, R users’ cultural belief that use of global variables is taboo.
Where did this belief originate? I think it can be traced back to the designers of R being paid up members of the functional programming movement of the early 80’s. This movement sought to mathematically prove programs correct but had to deal with the limitation that existing mathematical techniques were not really up to handling programs that contained states (e.g., variables that were assigned different values at different points in their execution). The solution was to invent a class of programming languages, functional languages, that did not provide any mechanisms for creating states (i.e., no global or local variables) and using such languages was touted as the solution to buggy code. The first half of the 80’s was full of computing PhD students implementing functional languages that had been designed by their supervisor, with the single application written by nearly all these languages being their own compiler.
Having to use a purely functional language to solve nontrivial problems proved to be mindbogglingly hard and support for local variables crept in and reading/writing files (which hold state) and of course global variables (but you must not use them because that would generate a side-effect; pointing to a use of a global variable in some postgrad’s code would result in agitated arm waving and references to a technique described in so-and-so’s paper which justified this particular use).
The functional world has moved on, or to be exact mathematical formalisms not exist that are capable of handling programs that have state. Modern users of functional languages don’t have any hangup about using global variables. The R community is something of a colonial outpost hanging on to views from a homeland of many years ago.
Isn’t the use of global variables recommended against in other languages? Yes and No. Many languages have different kinds of global variables, such as private and public (terms vary between languages); it is the use of public globals that may raise eyebrows, it may be ok to use them in certain ways but not others. The discussion in other languages revolves around higher level issues like information hiding and controlled access, ideas that R does not really have the language constructs to support (because R programs tend to be short there is rarely a need for such constructs).
Lets reformulate the question: “Is the use of global variables in R bad practice?”
The real question is: Given two programs, having identical external behavior, one that uses global variables and one that does not use global variables, which one will have the lowest economic cost? Economic cost here includes the time needed to figure out how to write the code and time to fix any bugs.
I am not aware of any empirical evidence, in any language, that answers this question (if you know of any please let me know). Any analysis of this question requires enumerating those problems where a solution involving a global variable might be thought to be worthwhile and comparing the global/nonglobal code; I know of a few snippets of such analysis in other languages.
Coming back to these long R functions, they often contain several for loops. Why are developers using for loops rather than the *ply functions? Is it because the *aply solution might require the use of a global variable, a cultural taboo that can be avoided by having everything in one function and using a for loop?
Next time somebody tells you that using global variables is bad practice you should ask for some evidence that backs that statement up.
I’m not saying that the use of global variables is good or bad, but that the issue is a complicated one. Enforcing a ‘no globals’ policy might just be moving the problem it was intended to solve to another place (inside long functions).
More men than women are incompetent/very competent
Womens’ rights campaigners are always making a big fuss about the huge impact equal rights/sex discrimination laws have had on increasing the career opportunities for very capable women to break the ‘glass ceiling’. The very capable end of the ability scale has always been sparsely populated and any significant impact is more likely to be noticeable in the less capable bands of the scale.
When I started out working in software development, if there was a women working on a team the chances were that she would be towards the very competent end of the scale (male/female ratio back then was what, 10/1?). These days, based on my limited experience, women are less likely to be competent but still a lot less likely, than men, to be completely incompetent.
Based on my experience+talking to others it would appear that women are still underrepresented at the very competent/incompetent ends of the scale in software development. Why might this be (apart from being a sample size issue)? While the average value of male/female intelligence are the same (IQ tests are constructed to make them equal), the variance in IQ between the sexes is very different. The following is taken from Population sex differences in IQ at age 11: the Scottish mental survey 1932
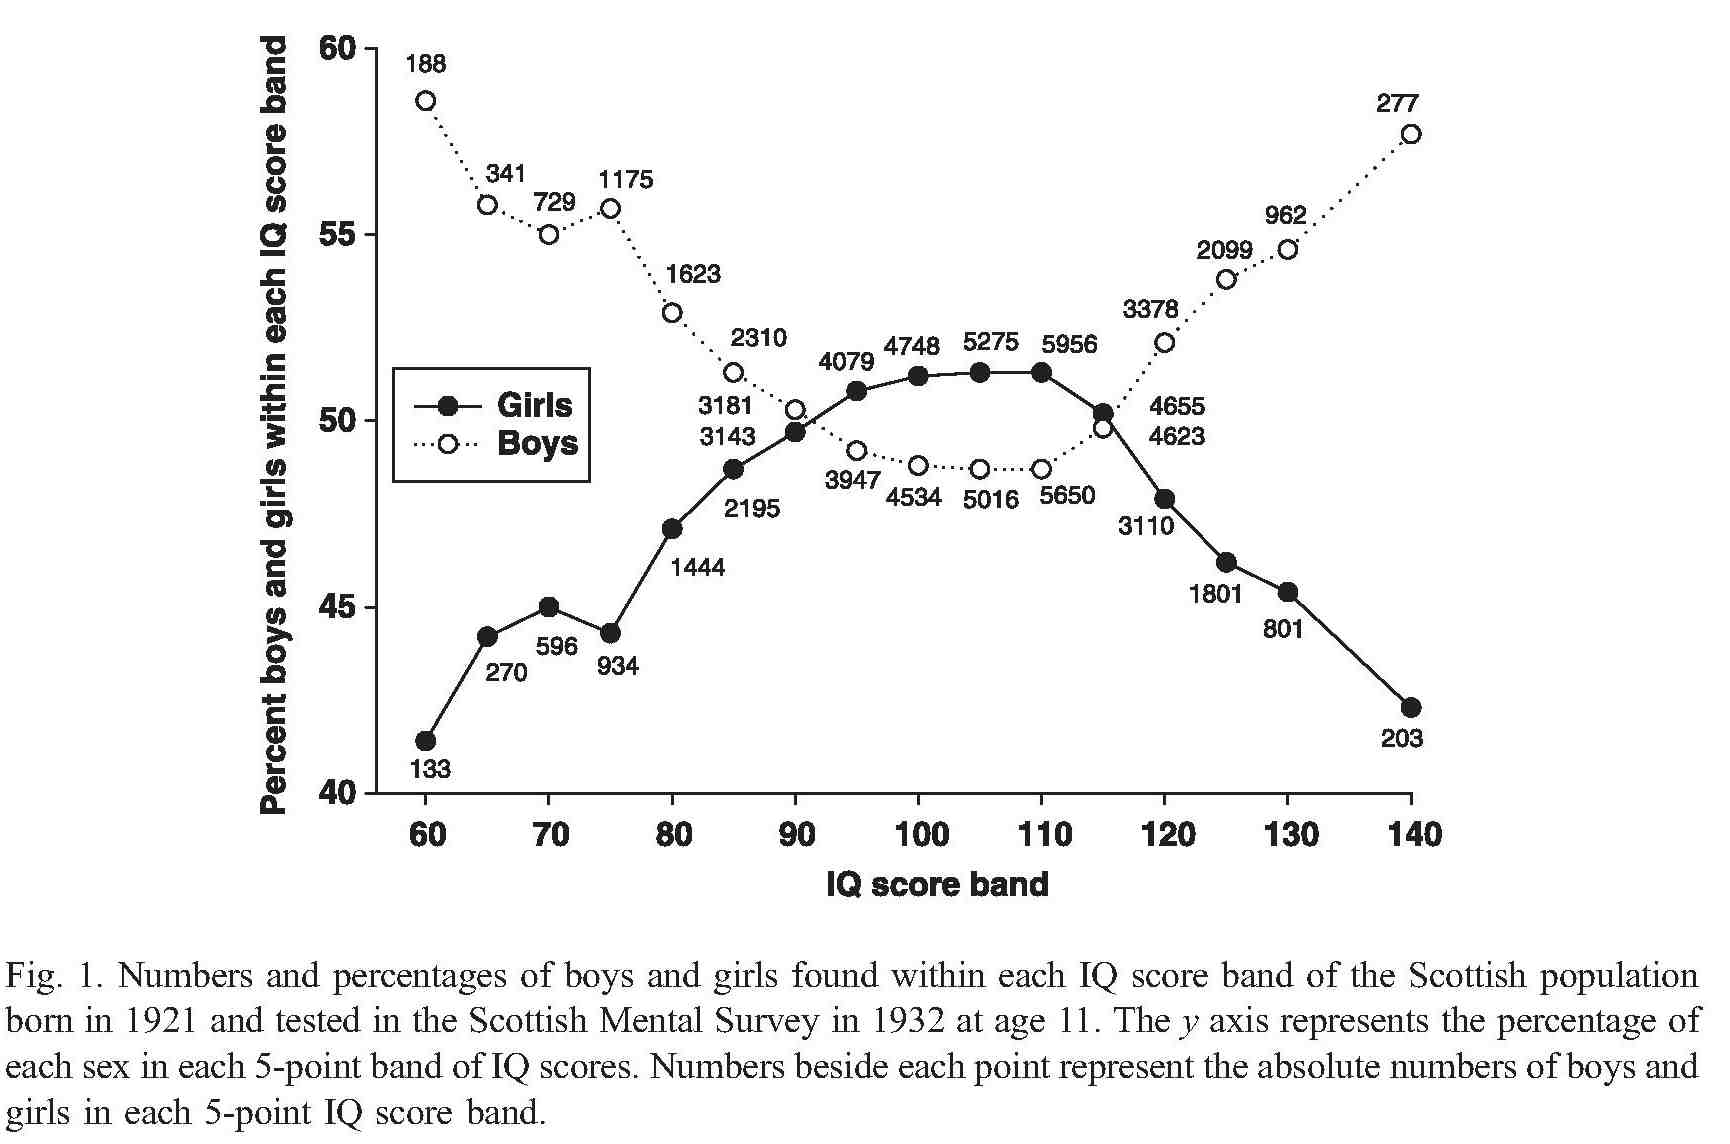
The above plot provides a possible explanation for the prevalence of men at the very competent/incompetent ends of the scale and suggests that women should outnumber men in the middle, competent, band.
In practice there are still far fewer women than men working in software engineering, so a comparison using absolute counts is not possible; good luck running a survey covering software developer competence.
If the above IQ distribution carries over to competencies then it seems to me that those seeking to attract more women into software engineering, and engineering in general, should be targeting the more populous middle competence band and not the high fliers. Companies make a big fuss about wanting high fliers but in practice are often willing to take on people who are likely to be competent if they are the safer choice (that guy who appeared rather unusual during the interview may turn out to be flop rather than a rock star).
R needs some bureaucracy
Writing a program in R is almost bureaucracy free: variables don’t need to be declared, the language does a reasonable job of guessing the type a value might need to be automatically be converted to, there is no need to create a function having a special name that gets called at program startup, the commonly used library functions are ready and waiting to be called and so on.
Not having a bureaucracy is all well and good when programs are small or short lived. Large programs need a bureaucracy to provide compartmentalization (most changes to X need to be prevented from having an impact outside of X, doing this without appropriate language support eventually burns out anybody juggling it all in their head) and long lived programs need a bureaucracy to provide version control (because R and its third-party libraries change over time).
Automatically installing a package from CRAN always fetches the latest version. This is all well and good during initial program development. But will the code still work in six months time? Perhaps the author of one of the packages used in the program submits a new version of that package to CRAN and this new version behaves slightly differently, breaking the previously working program. Once the problem is located the developer has either to update their code or manually install the older version of the package. Life would be easier if it was possible to specify the required package version number in the call to the library function.
Discovering that my code depends on a particular version of a CRAN package is an irritation. Discovering that two packages I use each have a dependency on different versions of the same package is a nightmare. Having to square this circle is known in the Microsoft Windows world as DLL hell.
There is a new paper out proposing a system of dependency versioning for package management. The author proposes adding a version parameter to the library function, plus lots of other potentially useful functionality.
Apart from changing the behavior of functions a program calls, what else can a package author do to break developer code? They can create new functions and variables. The following is some code that worked last week:
library("foo") # The function get_question is in this package library("bar") # The function give_answer_42 is in this package (the_question=get_question()) give_answer_42(the_question) |
between last week and today the author of package foo (or perhaps the author of one of the packages that foo has a dependency on) has added support for the function solve_problem_42 and it is this function that will now get called by this code (unless the ordering of the calls to library are switched). What developers need to be able to write is:
library("foo", import=c("the_question")) # The function get_question is in this package library("bar", import=c("give_answer_42")) # The function give_answer_42 is in this package (the_question=get_question()) give_answer_42(the_question) |
to stop this happening.
The import parameter enables developers to introduce some compartmentalization into my programs. Yes, R does have namespace management for packages, and I’m pleased to see that its use will be mandatory in R version 3.0.0, but this does not protect programs from functions the package author intends to export.
I’m not sure whether this import suggestion will connect with R users (who look very laissez faire to me), but I get very twitchy watching a call to library go off and install lots of other stuff and generate warnings about this and that being masked.
Verified compilers and soap powder advertising
There’s a new paper out claiming to be about a formally-verified C compiler, it even states a Theorem about its abilities! If this paper appeared as part of a Soap powder advert the Advertising Standards Authority would probably require clarification of the claims. What clarifications might appear in the small print tucked away at the bottom of the ad?
- C source code is not verified directly, it is first translated to the formal notations used by the verification system; the software that performs this translation is assumed to be correct.
- The CompCert system may successfully translate programs containing undefined behavior. Any proof statements made about such programs may not be valid.
- The support tools are assumed to be correct; primarily the Coq proof assistant, which is written in OCaml.
- The CompCert system makes decisions about implementation dependent behaviors and any proofs only apply in the context of these decisions.
- The CompCert system makes decisions about unspecified behaviors and any proofs only apply in the context of these decisions.
Some notes on the small print:
The C source translator used by CompCert rarely gets mentioned in any of the published papers; what was done to check its accuracy (I have previously discussed some options)? Presumably the developers who wrote it tried very hard to make sure they did a good job, just like the authors of f2c, a Fortran to C translator, did. Connecting f2c as a front-end of the CompCert system gives us a verified Fortran compiler! I think the f2c translator is much more likely to be correct than the CompCert C source translator, it has been used by a lot more people, processed a lot more source and maintained over a longer period.
When they encounter undefined behavior in source code production C compilers sometimes generate code that has very unexpected behavior. Using the CompCert system will not avoid unexpected behavior in these situations; CompCert simply washes its hands for this kind of code and says all bets are off.
Proving the support tools correct would simply move the assumption of correctness to a different set of tools. I am not aware of any major effort to test whether the Coq system behaves as intended, but have not read all the papers describing it (the list of reported faults is does not appear to be publicly available); bugs have been found in the OCaml implementation.
Like all compilers that generate code, CompCert has to make implementation dependent decisions and select one of the possible unspecified behaviors. The C-Semantics tool generates all unspecified behaviors, rather than just one.
Does native R usage exist?
Note to R users: Users of other languages enjoy spending lots of time discussing the minutiae of the language they use, something R users don’t appear to do; perhaps you spend your minutiae time on statistics which I don’t yet know well enough to spot when it occurs). There follows a minutiae post that may appear to be navel-gazing to you (interesting problem at the end though).
In various posts written about learning R I have said “I am trying to write R like a native”, which begs the question what does R written by a native look like? Assuming for a moment that ‘native R’ exists (I give some reasons why it might not below) how…
To help recognise native R it helps to start out by asking what it is not. Let’s start with an everyday analogy; if I listen to a French/German/American person speaking English I can usually tell what country they are from, they have patterns of usage that we in merry England very rarely, if ever, use; the same is true for programming languages. Back in the day when I spent several hours a day programming in various languages I could often tell when somebody showing me some Pascal code had previously spent many years writing Fortran or that although they were now using Fortran they had previously used Algol 60 for many years.
If expert developers can read R source and with high accuracy predict the language that its author previously spent many years using, then the source is not native R.
Having ruled out any code that is obviously (to a suitably knowledgeable person) not native R, is everything that is left native R? No, native language users share common characteristics; native speakers recognize these characteristics and feel at home. I’m not saying these characteristics are good, bad or indifferent any more than my southern English accent is better/worse than northern English or American accents; it is just the way people around here speak.
Having specified what I think is native R (I would apply the same rules to any language) it is time to ask whether it actually exists.
I’m sure there are people out there whose first language was R and who have spent a lot more time using R over, say, five years rather than any other language. Such people are unlikely to have picked up any noticeable coding accents from other languages and so can be treated as native.
Now we come to the common characteristics requirement, this is where I think an existence problem may exist.
How does one learn to use a language fluently? Taking non-R languages I am familiar with the essential ingredients seem to be:
- spending lots of time using the language, say a couple of hours a day for a few years
- talking to other, heavy, users of the language on a daily basis (often writing snippets of code when discussing problems they are working on),
- reading books and articles covering language usage.
I am not saying that these activities create good programmers, just that they result in language usage characteristics that are common across a large percentage of the population. Talking and reading provides the opportunity to learn specific techniques and writing lots of code provides the opportunity to make use these techniques second nature.
Are these activities possible for R?
- I would guess that most R programs are short, say under 150 lines. This is at least an order of magnitude shorter (if not two or three orders of magnitude) than program written in Java/C++/C/Fortran/etc. I know there are R users out there who have been spending a couple of hours a day using R over several years, but are they thinking about R coding or think about the statistics and what the data analysis really means. I suspect they are spending most of this R-usage thinking time on the statistics and data analysis,
- I can easily imagine groups of people using R and individuals having the opportunity to interact with other R users (do they talk about R and write snippets of code to describe their problem? I don’t work in an R work environment, so I don’t know the answer),
- Where are the R books and articles on language usage? They don’t exist, not in the sense of Sutter’s “Effective C++: 55 Specific Ways to Improve Your Programs and Designs” (there must be a several dozen of this kind of book for C++) Bloch’s “Java Puzzlers: Traps, Pitfalls, and Corner Cases” (probably only a handful for Java) and Koenig’s “C: Traps and Pitfalls” (again a couple of dozen for C). In places Crawley’s “The R Book” has the feel of this kind of book, but Matloff’s “The Art of R Programming” is really an introduction to R for people who already know another language (no discussion of art of R as such). R users write about statistics and data analysis, with the language being a useful tool.
I suspect that many people are actually writing R for short amounts of time to solve data analysis problems they spend a lot of time thinking about; they don’t discuss R the language much (so little opportunity to learn about the techniques that other people use) and they don’t write much code (so little opportunity to try out many new techniques).
Yes, there may be a few people who do spend a couple of hours a day thinking about R the language and also get to write lots of code, these people are more like high priests than your average user.
For the last two years I have been following a no for-loops policy in an attempt to make myself write R how the natives write it. I am beginning to suspect that this view of native R is really just me imposing beliefs from usage of other language that support whole vector/array operations, e.g., APL.
I encountered the following coding problem yesterday. Do you think the non-loop version should be how it is done in R or is the loop version more ‘natural’?
Given a vector of ordered items the problem is to count the length of each subsequence of identical items,
a,a,a,b,b,a,c,c,c,c,b,c,c |
output
a 3 b 2 a 1 c 4 b 1 c 2 |
Non-looping version (looping version is easy to figure out):
subseq_len=function(feature) { r_shift=c(feature[1], feature) l_shift=c(feature, ",,,") # pad with something that will not match # Where are the boundaries between subsequences? boundary=(l_shift != r_shift) sum_matches=cumsum(!boundary) # Difference of cumulative sum at boundaries, whose value will # be off by 1 and we need to handle 'virtual' start of list at 1. t=sum_matches[boundary] seq_len=1+c(t, 0)-c(1, t) # Remove spurious value return(cbind(feature[boundary[-1]], seq_len[-length(seq_len)])) } subseq_len(c("a", "a", "b", "b", "e", "c", "c", "c", "a", "c", "c")) |
Will incorrect answers be biased towards one arm of an if-statement?
Sometimes it is possible to deduce which arm of a nested if-statement will be executed by looking at the form of the conditional expression in the outer if-statement, as in:
if ((L < M) && (M < H)) if (L < H) ; // Execution always end up here else ; // dead code |
but not in:
if ((L > M) && (M < H)) if (L < H) ; // Could end up here else ; // or here |
I ran an experiment at the 2012 ACCU conference where subjects saw nested if-statements like those above and had to specify which arm of the nested if-statement would be executed.
Sometimes subjects gave an answer specifying one arm when in fact both arms are possible. Now dear reader, do you think these incorrect answers will specify the then arm 50% of the time and the else arm 50% or do you think that that incorrect answers will more often specify one particular arm?
Of course I should have thought about this before I started to analyse the data, but this question is unrelated to the subject of the experiment and has only just cropped up because of the unexpectedly high percentage of this kind of incorrect answer. I had an idea what the answer would be but did not stop and think about relative percentages, rushing off to write a few lines of code to print the actual totals, so now my mind is polluted by knowing the answer (well at least for one group of subjects in one experiment).
Why does this “one arm preference” issue matter? The Bayesians out there will insist that the expected distribution (the prior in Bayesian terminology) of incorrectly chosen arms be factored in to the calculation of the probability of getting the numbers seen in the results. The paper Belgian euro coins: 140 heads in 250 tosses – suspicious? gives a succinct summary of the possibilities.
So I have decided to appeal to my experienced readership, yes YOU!
For those questions where the actual execution cannot be predicted in advance, from knowledge of the relative values of variables appearing in the outer if-statement, when an incorrect answer is given should the analysis assume:
- a 50/50 split of incorrect answers between each arm, or
- subjects are more likely to pick one arm; please specify a percentage breakdown between arms.
No pressure, but the submission deadline is very late tomorrow.
The results from the whole experiment will get written up here in future posts.
Update (three days later): Nobody was willing to stick their head above the parapet 🙁
There were 69 correct answers and 16 incorrect answers to questions whose answer was “both arm”. Ten of those incorrect answers specified the ‘then’ arm and 6 the ‘else’; my gut feeling was that there should be even more ‘then’ answers. If there was no “first arm” there is an equal probability of a subject’s incorrect answer appearing in either arm; in this case the probability of a 10/6 split is 12% (so my gut feeling was just hunger pangs after all).
Will programming languages now have to follow ISO fast-track rules?
A while back I wrote about how updated versions of ECMAscript (i.e., the Standard for Javascript) had twice been fast tracked to replace an existing ISO Standard, however the ISO rules require that once a document becomes one of its standards all future work be done using the ISO process (i.e., you only supposed to get the one original fast track and then you have to get at least half a dozen countries to say they will actively participate in ongoing work). Thirteen years after I asked why it was being allowed to happen (as I recall I only raised the issue because I thought I had misunderstood the rules, not because I had a burning desire to enforce them) the issue has suddenly sprung to life (we are talking Standard’s world ‘sudden’ here), with a question being raised at the last SC22 meeting and a more detailed one being prepared by BSI for the next meeting (they occur once per year).
The Elephant in the room here is ISO/IEC 29500:2008, not a programming language but Microsoft’s Office Open XML; there was quite a bit of fuss when this was fast tracked.
If the ISO rules on one-time only use of the fast track process was limited to programming languages I imagine the bureaucrats in Geneva would probably never get to hear about it (SC22 would probably conclude that there was not enough interest in the various documents outside of the submitting country to form an active ISO working group; so leave well alone).
ISO sells over 19,000 standards and has better things to do than spend time on the goings on in an unfashionable part of the galaxy, unless, that is, it has the potential to generate lots of fuss that undermines credibility.
Will Microsoft try to fast track an updated version of ISO 29500? I don’t even know if they are updating it. The possibility that ISO 29500 might be updated and submitted for fast track will make it hard for SC22 to agree to any future fast-track updates to existing ISO Standards it is responsible for.
The following is a list of documents that have been fast tracked to become an ISO Standard:
ECMAScript:
ECMA-262 (1st edn) = ISO 16262:1998
ECMA-262 (3rd edn) = ISO 16262:1999
ECMA-262 (5th edn) = ISO 16262:2011

C#:
ECMA-334 (2nd edn) = ISO 23270:2003
ECMA-334 (4th edn) = ISO 23270:2006

CLI:
ECMA-335 (2nd edn) = ISO 23271:2003
ECMA-335 (6th edn) = ISO 23271:2012

ECMA standards fast-tracked to ISO and not yet revised:
ECMA-149 PCTE part 1 = ISO 13719-1:1998
ECMA-158 PCTE part 2 = ISO 13719-2:1998
ECMA-162 PCTE part 3 = ISO 13719-3:1998
ECMA-230 PCTE IDL binding = ISO 13719-4:1998
ECMA-367 EIFFEL = ISO 25436:2006
ECMA-372 C++/CLI -> DIS 26926; failed DIS ballot and project cancelled

Replaced rather than revised under JTC1 rules:
CHILL (from CCITT): ISO standards 9496:1989, 9496:1995, 9496:1998, 9496:2003
MUMPS/M (from Mass Gen Hospital/ANSI): ISO standards 11756:1992, 11756:1999

Non-ECMA documents fast-tracked through ISO and not yet revised:
FORTH (from FORTH Inc): ISO 15145:1997
JEFF (from J consortium): ISO 20970:2002
Ruby (from Japanese Industrial Standards Committee): ISO/IEC 30170:2012
Popularity of Open source Operating systems over time
Surveys of operating system usage trends are regularly published and we get to read about how the various Microsoft products are doing and the onward progress of mobile OSs; sometimes Linux gets an entry at the bottom of the list, sometimes it is just ‘others’ and sometimes it is both.
Operating systems are pervasive and a variety of groups actively track reported faults in order to issue warnings to the public; the volume of OS fault informations available makes it an obvious candidate for testing fault prediction models (e.g., how many faults will occur in a given period of time). A very interesting fault history analysis of OpenBSD in a paper by Ozment and Schechter recently caught my eye and I wondered if the fault time-line could be explained by the time-line of OpenBSD usage (e.g., more users more faults reported). While collecting OS usage information is not the primary goal for me I thought people would be interested in what I have found out and in particular to share the OS usage data I have managed to obtain.
How might operating system usage be measured? Analyzing web server logs is an obvious candidate method; when a web browser requests information many web servers write information about the request to a log file and this information sometimes includes the name of the operating system on which the browser is running.
Other sources of information include items sold (licenses in Microsoft’s case, CDs/DVD’s for Open source or perhaps books {but book sales tend not to be reported in the way programming language book sales are reported}) and job adverts.
For my time-line analysis I needed OpenBSD usage information between 1998 and 2005.
The best source of information I found, by far, of Open source OS usage derived from server logs (around 138 million Open source specific entries) is that provided by Distrowatch who count over 700 different distributions as far back as 2002. What is more Ladislav Bodnar the founder and executive editor of DistroWatch was happy to run a script I sent him to extract the count data I was interested in (I am not duplicating Distrowatch’s popularity lists here, just providing the 14 day totals for OS count data). Some analysis of this data below.
As luck would have it I recently read a paper by Diomidis Spinellis which had used server log data to estimate the adoption of Open Source within organizations. Diomidis researches Open source and was willing to run a script I wrote to extract the User Agent string from the 278 million records he had (unfortunately I cannot make this public because it might contain personal information such as email addresses, just the monthly totals for OS count data, tar file of all the scripts I used to process this raw log data; the script to try on your own logs is countos.sh).
My attempt to extract OS names from the list of User Agent strings Diomidis sent me (67% of of the original log entries did contain a User Agent string) provides some insight into the reliability of this approach to counting usage (getos.awk is the script to try on the strings extracted with the earlier script). There is no generally agreed standard for:
- what information should be present; 6% of UA strings contained no OS name that I knew (this excludes those entries that were obviously robots/crawlers/spiders/etc),
- the character string used to specify a given OS or a distribution; the only option is to match a known list of names (OS names used by Distrowatch,
missos.awkis the tar file script to print out any string not containing a specified list of OS names, the Wikipedia List of operating systems article), - quality assurance; some people cannot spell ‘windows’ correctly and even though the source is now available I don’t think anybody uses CP/M to access the web (at least 91 strings,
 %, would not have passed).
Ladislav Bodnar thinks that log entries from the same IP addresses should only be counted once per day per OS name. I agree that this approach is much better than ignoring address information; why should a person who makes 10 accesses be counted 10 times, a person who makes one access is only counted once. It is possible that two or more separate machines running the same OS are accessing the Internet through a common gateway that results in them having the IP address from an external server’s point of view; this possibility means that the Distrowatch data undercounts the unique accesses (not a serious problem if most visitors have direct Internet access rather than through a corporate network).
The Distrowatch data includes counts for all IP address and from 13 May 2004 onwards unique IP address per day per OS. The mean ratio between these two values, summed over all OS counts within 14 day periods, is 1.9 (standard deviation 0.08) and the Pearson correlation coefficient between them is 0.987 (95% confidence interval is 0.984 to 0.990), i.e., almost perfect correlation.
The Spinellis data ignores IP address information (I got this dataset first, and have already spent too much time collecting to do more data extraction) and has 10 million UA strings containing Open source OS names (6% of all OS names matched).
How representative are the Distrowatch and Spinellis data? The data is as representative of the general OS population as the visitors recorded in the respective server logs are representative of OS usage. The plot below shows the percentage of visitors to Distrowatch that use Ubuntu, Suse, Redhat. Why does Redhat, a very large company in the Open source world, have such a low percentage compared to Ubuntu? I imagine because Redhat customers get their updates from Redhat and don’t see a need to visit sites such as Distrowatch; a similar argument can be applied to Suse. Perhaps the Distrowatch data underestimates those distributions that have well known websites and users who have no interest in other distributions. I have not done much analysis of the Spinellis data.
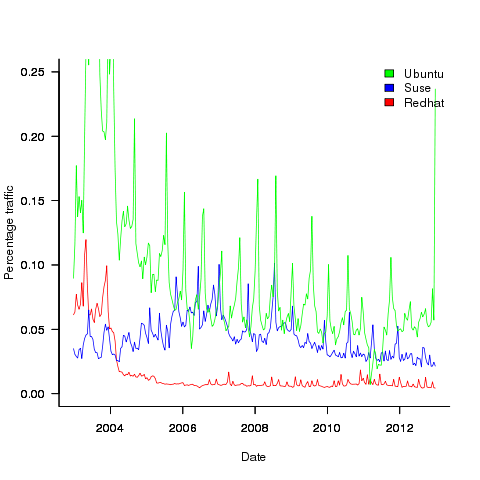
Presumably the spikes in usage occur around releases of new versions, I have not checked.
For my analysis I am interested in relative change over time, which means that representativeness and not knowing the absolute number of OSs in use is not a problem. Researchers interested in a representative sample or estimating the total number of OSs in use are going to need a wider selection of data; they might be interested in the following OS usage information I managed to find (yes I know about Netcraft, they charge money for detailed data and I have not checked what the Wayback Machine has on file):
- Wikimedia has OS count information back to 2009. Going forward this is a source of log data to rival Distrowatch’s, but the author of the scripts probably ought to update the list of OS names matched against,
- w3schools has good summary data for many months going back to 2003,
- statcounter has good summary data (daily, weekly, monthly) going back to 2008,
- TheCounter.com had data from 2000 to 2009 (csv file containing counts obtained from Wayback Machine).
If any reader has or knows anybody who has detailed OS usage data please consider sharing it with everybody.
Only compiler vendor customers, not its users, count
The hardest thing about working on compilers is getting somebody to pay you to do it (its a close run race against having the cpu instructions chop and change under you during initial development, but that’s another story). The major shift of compiler vendor business model from proprietary to open source has significant implications for users of compilers. Note I said user not customer, only one of them pays money. Under the commercial model there was usually a very direct connection between compiler user and customer (even in large organizations users rather than the manager who makes the purchase decision are often regarded by vendors as the customer), while under the Open source model most users are not customers (paying money for a distribution does not make you a customer of the people maintaining the compiler who probably don’t receive any of the money you spent).
Like all good businesses compiler vendors don’t want to make their customers unhappy. There is one way guaranteed to make all customers so unhappy that they will remember the experience for years; ship a new compiler release that breaks their existing code (this usually happens because their is a previously undetected bug in the code or because use is being made of an implemented defined/undefined part of the language {the compiler gets to decide what to do when it encounters such code}). Not breaking existing customer code is priority ONE in any commercial compiler development group.
Proprietary vendors have so many customers its almost impossible for them to know in advance what changes will break existing code and the only option is to be ultra conservative about adding new code optimizations (new optimizations can so easily change how source containing undefined behavior is processed). Ultra conservative is the polite term, management paranoia would be more accurate. There is another advantage to vendors for not breaking their customers’ code, they are protected against competition by new market entrants; a new vendor with a shiny go faster compiler doing all the optimizations the existing vendor was not willing to do in case it broke existing code will quickly find out that the performance improvements they offer are rarely big enough to tempt potential customers to switch compilers. Really, the only time companies switch compiler is when they have to port to a new platform to make a sale or their existing vendor goes bust.
Open source vendors (e.g., those commercially involved in support/maintenance of gcc or llvm) have relatively few customers (e.g., big companies paying them lots of money for specific reasons) and as always these customers want existing code to continue to work. If the customer is paying for a code generator for a previously unsupported processor then there probably isn’t any existing code for that processor; it is a fact of life that porting source to a new processor always involves work. Some Linux distributors (e.g., Suse and Redhat) are customers in the sense that they pay the salary of developers who spend a lot of their time in compiler maintenance/upgrades and presumably work to try and ensure that the code in their respective Linux distributions does not get broken.
Compiler users who are not customers don’t count on the code breakage front (well, count for very very little, if an update broke lots of different developers’ code and enough fuss was made there might well be an update than unbroke the previous one).
What can a user do if code that used to work ok is broken when compiled with a later version of the compiler? The obvious answer is to continue using the older version that produces the desired behavior, fixing the code causing the problem is a better answer (but might involve a lot of work). There is no point in flaming the compiler developers, you are not contributing towards their upkeep; Open source does not give users the consideration that a customer enjoys.
The most worthwhile R coding guidelines I know
Since my post questioning whether native R usage exists (e.g., a common set of R coding patterns) several people have asked about coding/style guidelines for R. My approach to style/coding guidelines is economic, adhering to a guideline involves paying a cost now for some future benefit. Obviously to be worthwhile the benefit must be greater than the cost, there is also the issue of who pays the cost and who reaps the benefit (why would anybody pay the cost if somebody else reaps the benefit?). The following three topics are probably where the biggest benefits are to be had and only the third is specific to R (and given the state of my R knowledge may be wrong).
Comment your code. Investing 5-10 seconds per few lines of code now could save substantially more time at some future date. Effective commenting is a skill that has to be learned, start learning now. Think of commenting as sending a text message or tweet to the person you will be in 6 months time (i.e., the person who can hum the tune but has forgotten the details).
Consistently use variable names that mean something to you. This should be a sub 2-second decision that is probably going to save you no more than 5-10 seconds, but in many cases you reap the benefit soon after the investment, without having to wait many months. Names evoke associations in your mind, take advantage of this associative lookup to reduce the cognitive load of working with your code. Effective naming is a skill that has to be learned, start learning now. There are people who ignore the evidence that different people’s linguistic preferences and associations can be very different and insist that everybody adhere to one particular naming convention; ignore them.
Code organization and structure. Experience shows that there are ways of organizing and structuring +1,000 line programs that have a significant impact on the effort needed to actively work on the code, the more code there is the greater the impact. R programs tend to be short, say around 100 lines (I dare say much longer ones exist). Apart from recommending that code be broken up into separate functions, I cannot think of any organizational/structural issue that is worth recommending for 100 lines of code (if you don’t appreciate the advantage of using separate functions you need some hands on training, not words in a blog post).
Is that it, are there no other worthwhile recommendations? There might be, I just don’t have enough experience using R to know. Does anybody else have enough experience to know? I suspect not; where would they have gotten the information needed to do the cost/benefit analysis? Even in the rare case where a detailed analysis is made for a language the results are rather thin on the ground and somewhat inconclusive.
What is the reason behind those R style guides/coding guideline documents that have been written? The following are some possibilities:
and no, I don’t have any empirical data to backup my guidelines 🙁