Archive
MC/DC a step towards safety critical Open source software
Open source projects and safety critical software are at opposite ends of the development process spectrum. From the user perspective, when an Open source project becomes very widely used within its application domain, there is a huge incentive to run it within safety critical domains.
How might software that was not originally developed using a safety critical process be certified for use in a safety critical domain?
A mass of process bureaucracy has sprung up around building software systems whose correct operation is depended on in safety critical situations. There is no evidence that any process bureaucracy produces more reliable software than any other process bureaucracy, and organizations adapt processes to fit within the rules and deliver a system given the available funding.
Some processes specify measurable output requirements, and being able to show that a program developed using an Open source process meets the desired measurable requirements is a step on the path to possible certification. One of the requirements specified in DO-178C (“Software Considerations in Airborne Systems and Equipment Certification”, a non-free publication) for level A: Anomalous behavior produces a catastrophic failure condition, is 100% Modified condition/decision coverage (MC/DC) of the source code. In the automotive world, the same coverage requirement is specified for Automotive Safety Integrity Level D of ISO 26262. As far as I know, the only DO-178C certified Open source program, at this level (which does not imply being safety critical), is SQLite.
The two main hurdles to the adoption of MC/DC by Open source projects are the huge amount of work involved in creating the necessary tests and, until recently, the lack of industrial strength Open source tools for measuring MC/DC (there are many commercial tools).
While compiler support for statement coverage has long been available in both GCC and clang, support for MC/DC only became available in an official release of clang this year (the initial functionality was pushed in 2021). The official releases of GCC do not yet support MC/DC, but a patch has been available since 2022 (talk by author).
Making available an industrial strength Open source compiler that supports MC/DC testing removes one barrier on the path to DO-178C certification of Open source programs. The certification process itself requires that support tools meet certain minimum requirements, which are specified in DO-330. A tool used as part of the verification process of a program at Level A needed not itself have 100% MC/DC, or even 100% statement coverage. The LLVM project tracks statement coverage, which is not even close to 100%.
Are there any coding constructs that get in the way of achieving 100% MC/DC?
It’s possible to write a condition that cannot be tested in a way that meets the MC/DC requirement: Each condition in a decision is shown to independently affect the outcome of the decision. For instance, in the following condition:
if ((A && B) || (!A && C)) |
the value of the variable A affects the outcome of both operands of ||, and the complete expression cannot be rewritten, using just A, B, C, to change this situation. The complete boolean expression is said to be strongly coupled. An expression involving the same variable in multiple relational or equality tests (e.g., (x > 0) && (x < 10)) is said to be weakly coupled.
An analysis of the Ada source code (appendix C) contained in five aircraft flight recorders finds examples of strongly and weakly coupled conditions. This suggests that occurrences of these construct in source code does not prevent a program becoming DO-178C certified.
Linux must be the prime candidate for an Open source program being considered for some kind of safety critical certification. A kernel patch to support MC/DC profiling is in the works (with a kernel MC/DC of around 2.33%, lots of new tests are going to have to be written). Lots of other significant certification requirements also need to be met.
In C, around 90% of if-statements contain a single conditional test (statement 1739), while in Java around 90% of if-statements contain a single conditional test, with around 0.1% containing five or more.
A kind of coverage that is not so often discussed is object code structural coverage, i.e., coverage based on the conditions contained in generated machine code, such as from a compiler. Object code coverage is designed to handle the possibility of compilers generating code containing conditions that are not present in the original source.
Some compilers generate the same machine code for both top level if-statements in the following code:
int g; void square(int a, int b, int c) { if (a && b && c) g++; if (a) if (b) if (c) g++; } |
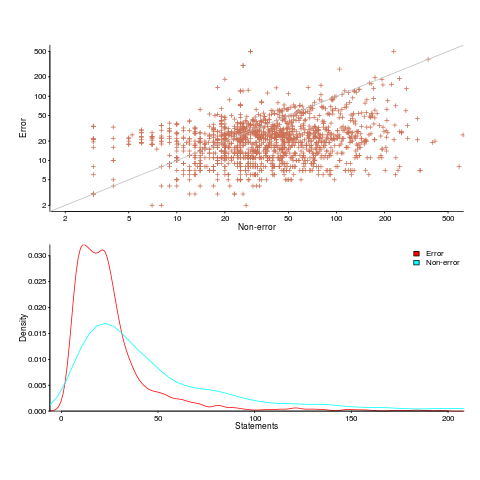
Statement sequence length for error/non-error paths
One of the folk truisms of the compiler/source code analysis business is that error paths are short, i.e., when an error situation is detected (such as failing to open a file), few statements are executed before the functions returns.
Having repeated this truism for many decades, figure 2 from the paper APEx: Automated Inference of Error Specifications for C APIs jumped off the page at me; thanks to Yuan Kang, I now have a copy of the data.
The plots below (code+data) show two representations of the non-error/error path lengths (measured in statements within individual functions of libc; counting starts at a library call that could return an error value). The upper plot shows statement sequence lengths for error/non-error paths, and the lower is a kernel density plot of the error/non-error sequence lengths.
Another truism is that people tend to write positive tests, i.e., tests that do not involve error handling (some evidence).
Code coverage measurements (e.g., number of statements or branches that are executed by a test suite) often show the pattern seen in the plot below (code+data; thanks to the authors of the paper Code Coverage for Suite Evaluation by Developers for making the data available). The data was obtained by measuring the coverage of 1,043 Java programs executing their associated test suite (circles denote program size). Lines are fitted regression models for different sized programs.
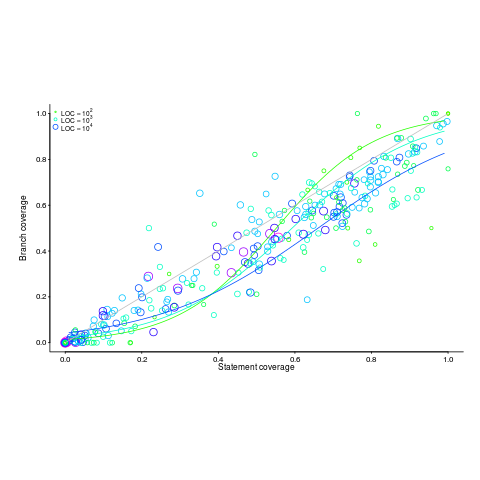
If people are preferentially writing positive tests, test suites with low coverage would be expected to execute a greater percentage of statements than branches (an if-statement has two branches, taken/not-taken), i.e., the behavior seen in the plot above (grey line shows equal statement/branch coverage). Once the low hanging fruit is tested (i.e., the longer, non-error, cases), tests have to be written for the shorter, more likely to be error handling, cases.
The plot would also be explained by typical execution paths favoring longer basic blocks, but I don’t have any data that could show this one way or another.
Low defect density implies climate code less, not more, reliable
I have just been reading a paper comparing the defect density of three climate modelling systems against software from other application domains. The defect density (total reported defects divided by thousands of lines of code) of the climate modelling software was significantly lower than everything else, leading the researchers to conclude that “… suggests that the models are of high software quality,”. I would draw the opposite conclusion, the models have low reliability (I have no idea what software quality is and avoid using the term).
I don’t disagree with Pipitone and Easterbrook numbers, just their conclusion.
There is a very simple technique for creating software that has a low defect density, don’t try too hard to look for defects. There are two reasons why I think this has happened with the climate model software:
- Three of the non-climate systems compared against were the Apache HTTP demon, the VTK visulalization toolkit and the Eclipse project. These are all widely used projects with many thousands of users, millions for Apache; this volume of usage corresponds to a huge amount of testing, and it is no wonder that so many faults have been reported. Each climate model tends to be used by one site, a tiny amount of testing, and it is not surprising that few faults have been reported.
- Climate models have a big intrinsic testing problem; what is the result of a test supposed to be? With applications such as word processors, browsers, compilers, operating systems, etc the expected behavior is known in many cases so it is possible to write test cases that check for the expected behavior. How does anybody know what the expected behavior of a climate model is? If all the climate models did was to solve the Navier-Stokes equation on a rotating sphere there would be no need for multiple models and the UK Meteorological Office’s Unified model would not have grown from 100 KLOC to 800+ KLOC over the last 15 years.
The one system having a similar defect density to the climate models that Pipitone and Easterbrook compare against is an air traffic control system developed using formal methods, exactly the kind of (expensive and time-consuming) development process that one would expect to have a low defect density.
Software is remarkably fault-tolerant and so, yes, serious fault could exist in the climate models and they would still give answers that looked about right. Based on his experience working on a meteorological model Les Hatton tells the story of a fault so serious that the answers should be completely wrong, but they were not.
If somebody wants to convince me that the software in any of these climate models really is reliable then I want to know about the test suites used to check the behavior; what coverage of the source does the suite have (a high MC/DC would be very good, but I would settle for a very high statement coverage) and how were the expected behaviors calculated.
Recent Comments